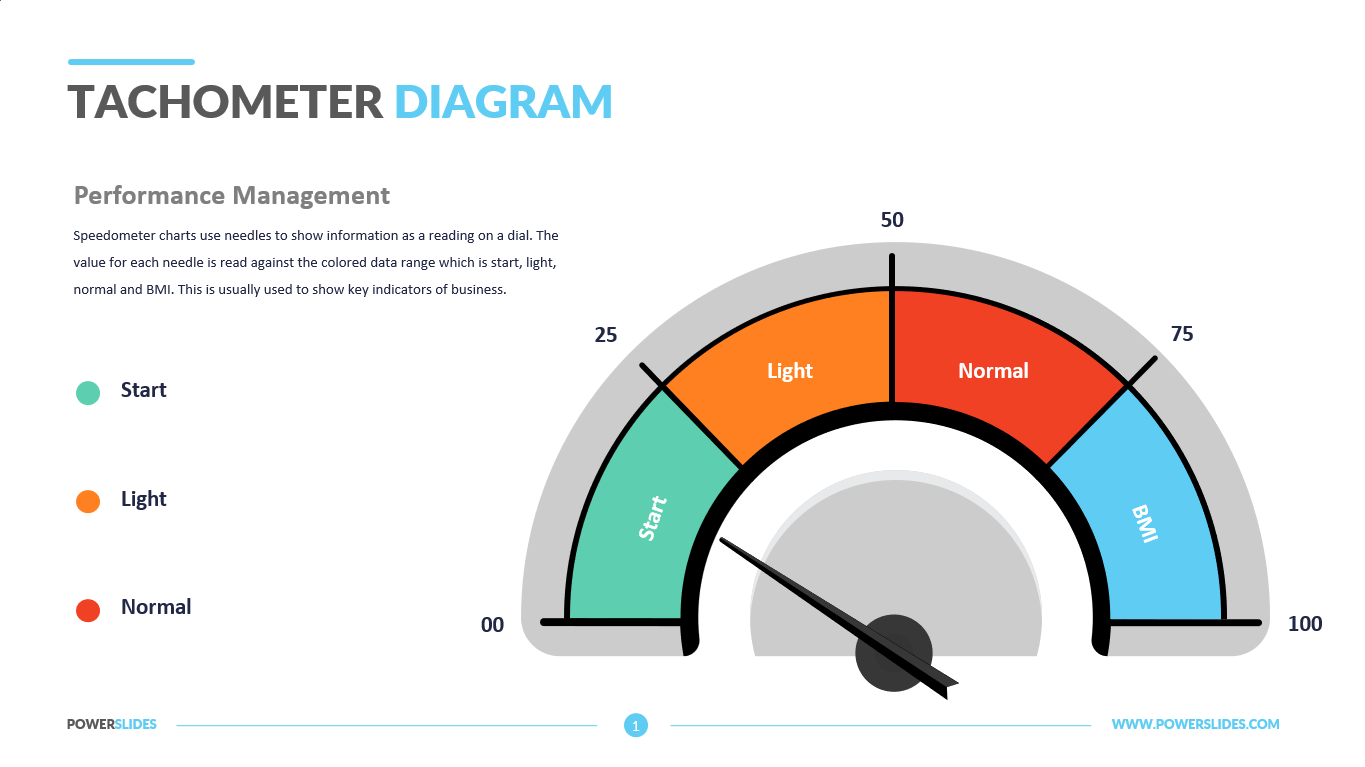
Tachometer Diagram
What do you think of this template?


 (2.33/ 5)
7 ratings

 4 Slides
 File size: 16:9
 Fonts: Lato Black, Calibri
 Supported version
PPT 2010, PPT 2013, PPT 2016
Supported version
PPT 2010, PPT 2013, PPT 2016

Product details
Infographics are a graphical way of presenting information, data and knowledge with the goal of quickly and clearly presenting complex information. One of the forms of graphic and communication design. The range of its application is huge – geography, journalism, education, statistics, technical texts.
By combining elements of text image, chart, diagram and, more recently, video, an infographic is an effective tool to present data and explain complex issues in a way that can quickly lead to insight and better understanding. Good infographics need to be focused with a clear idea of who the target audience is and what the core message will be.
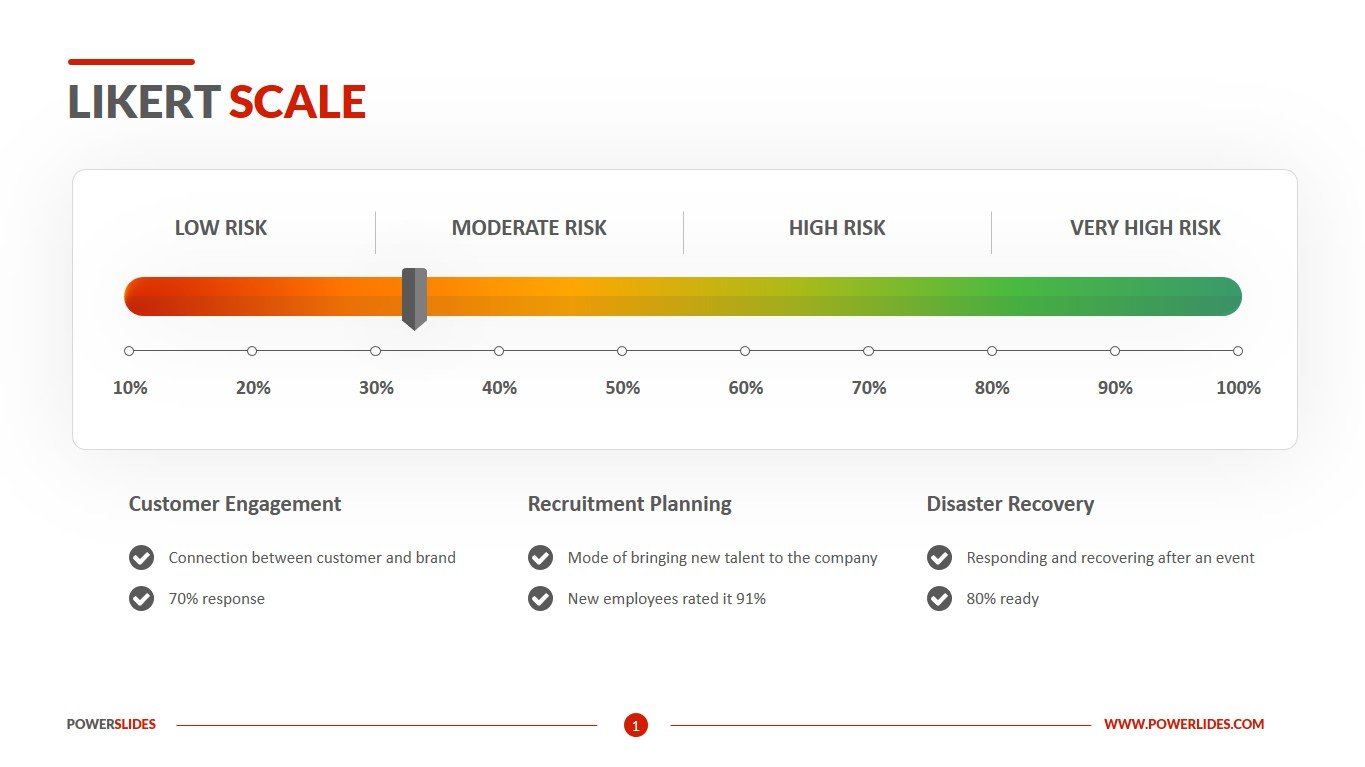
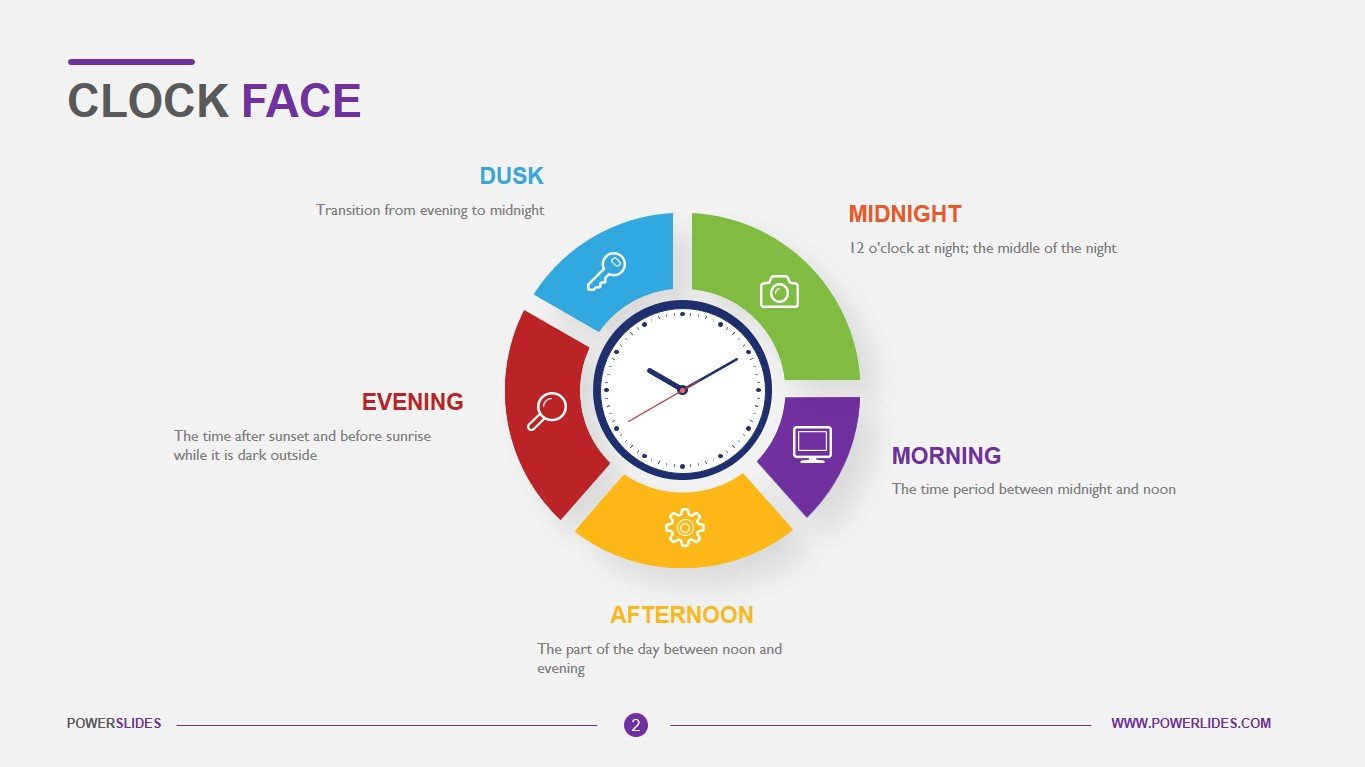
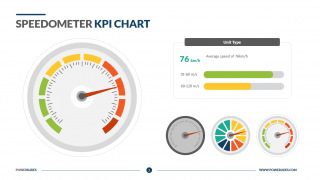
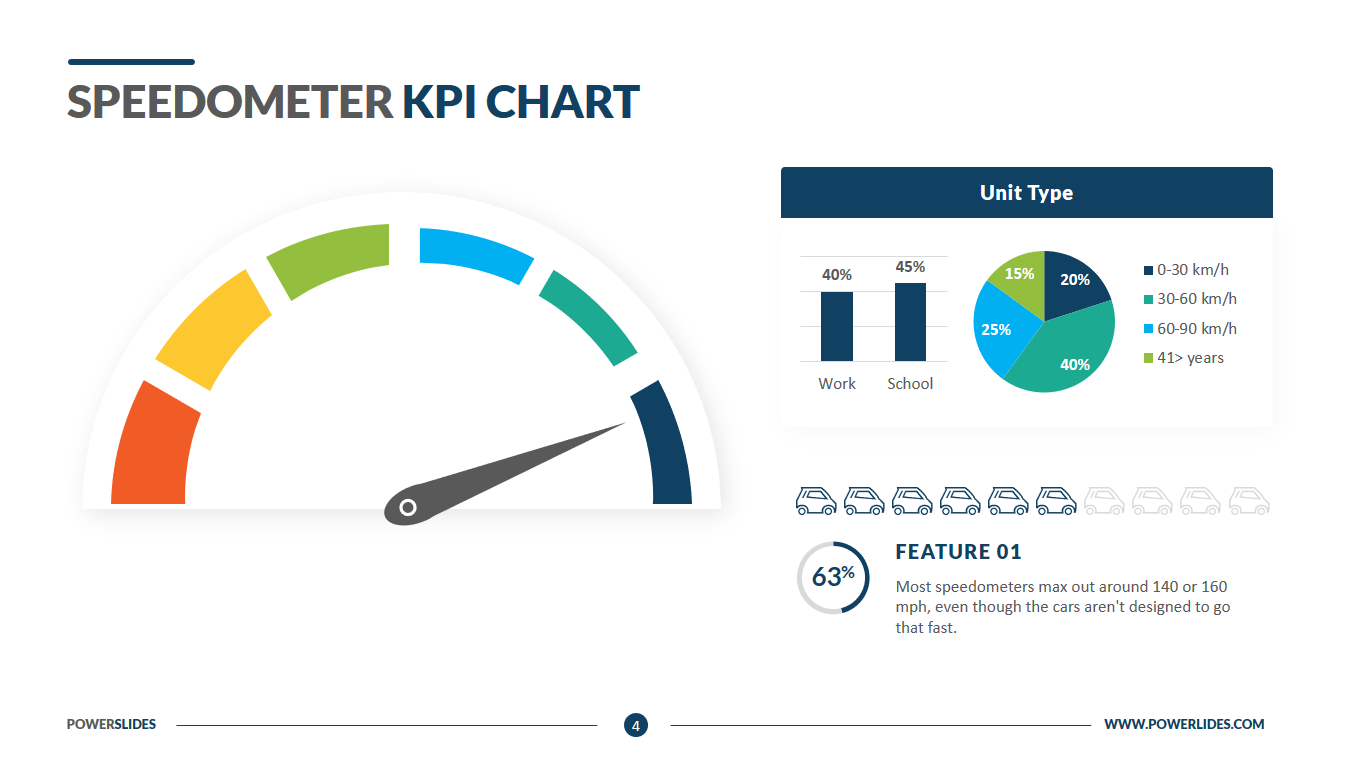
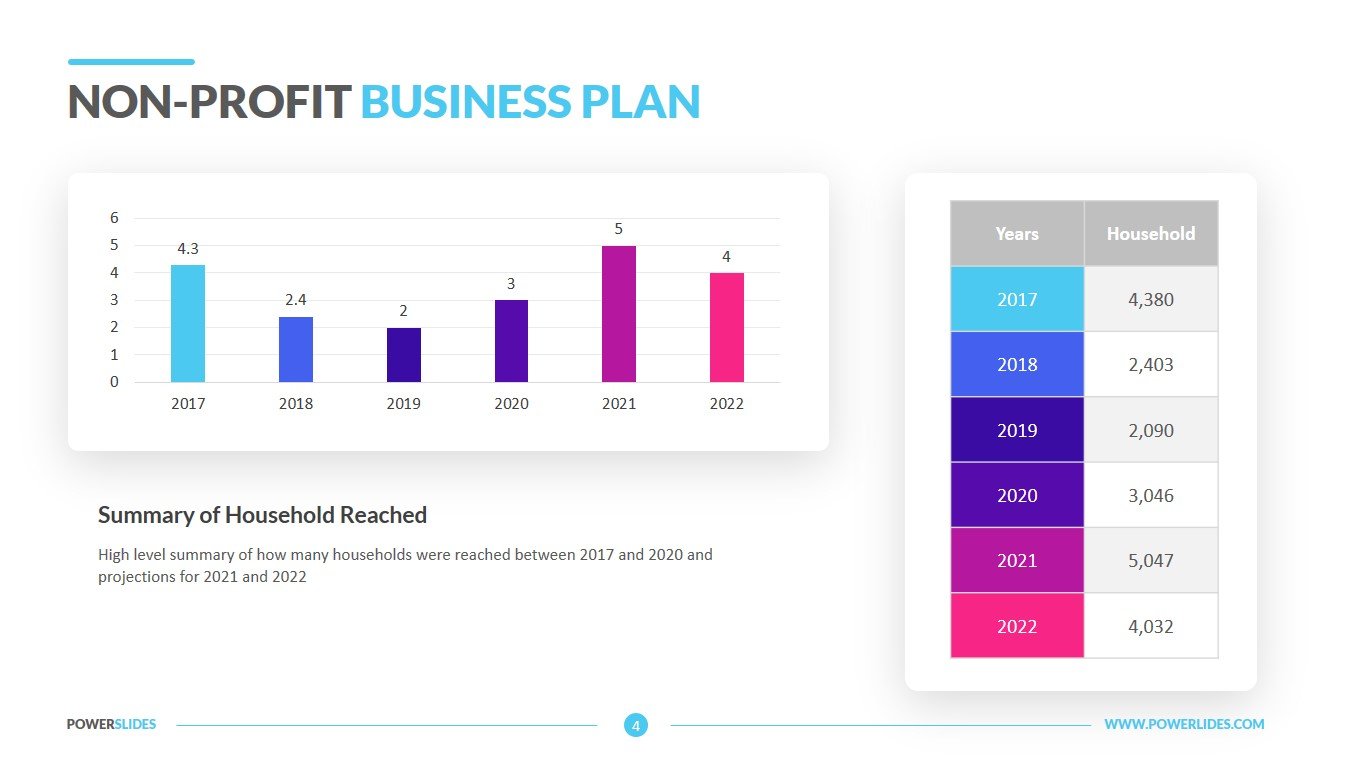
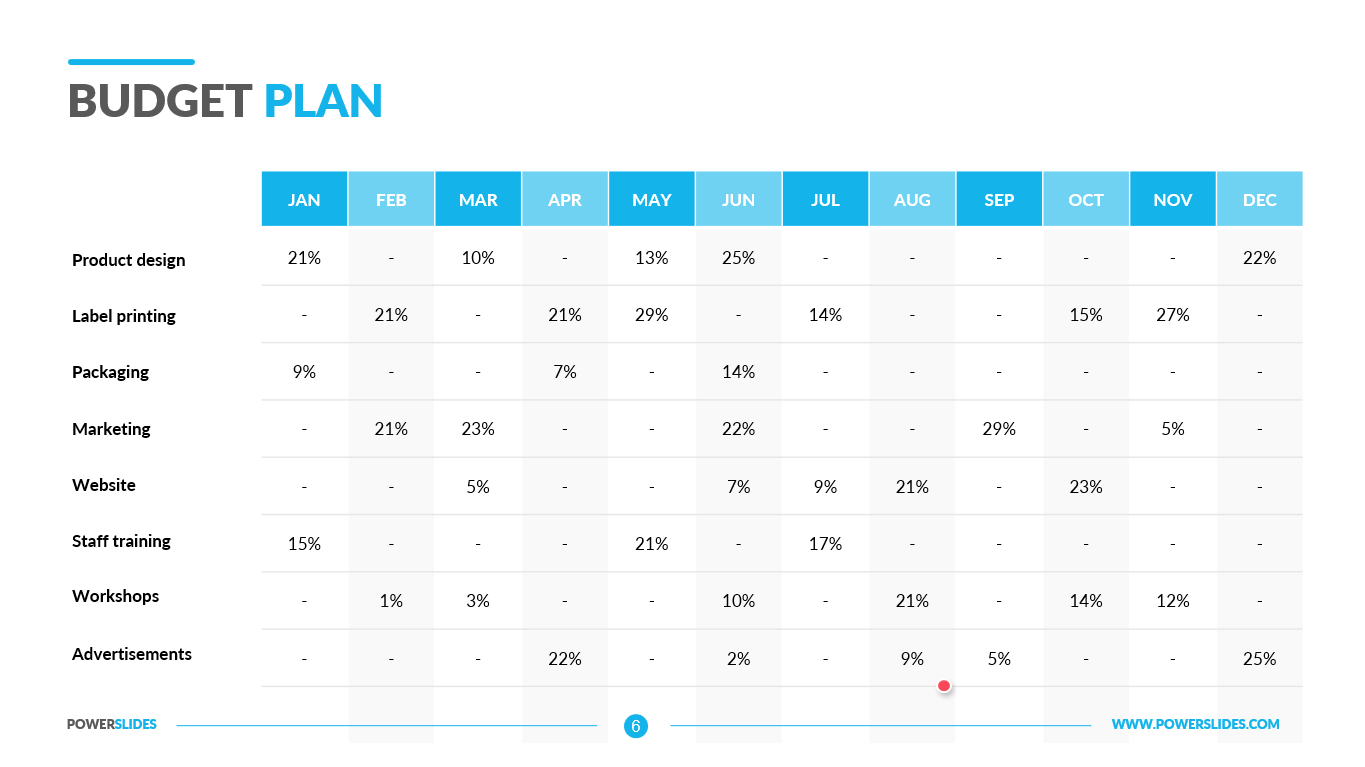
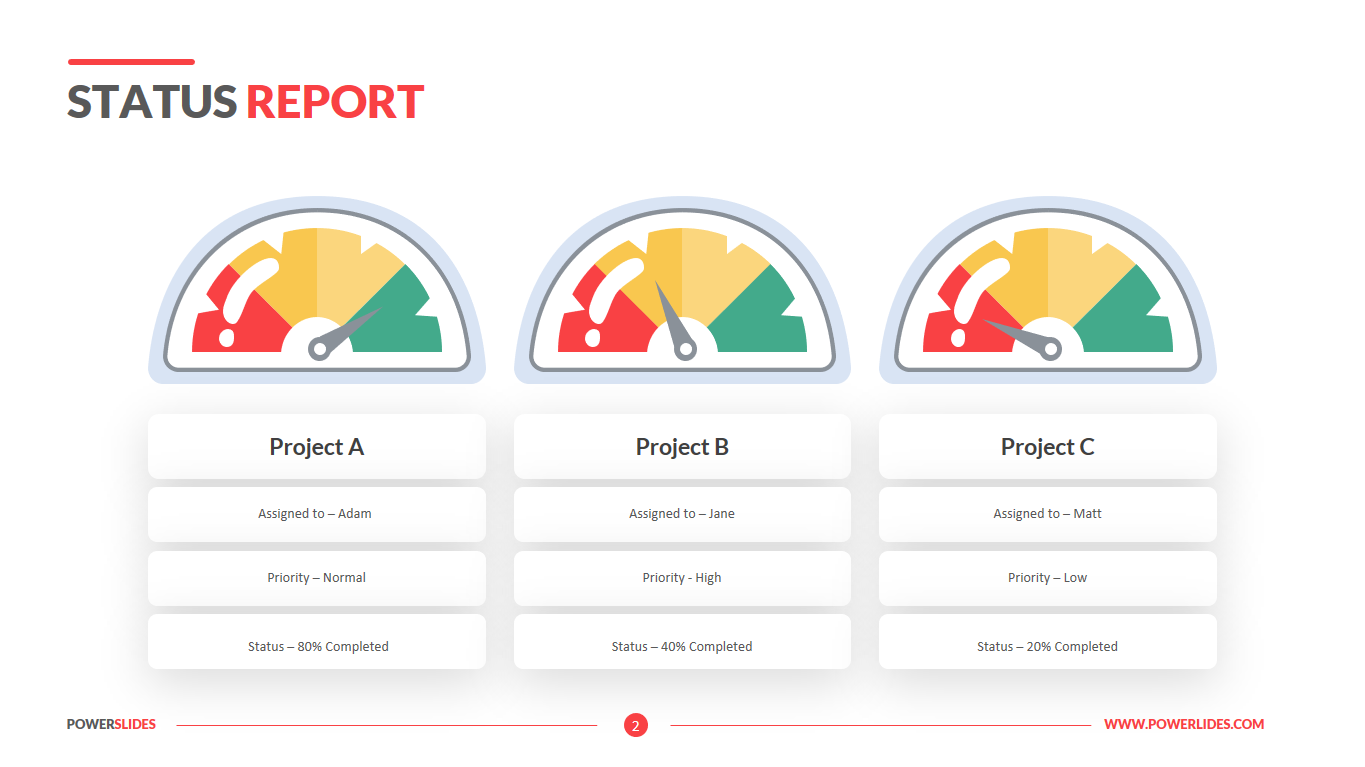
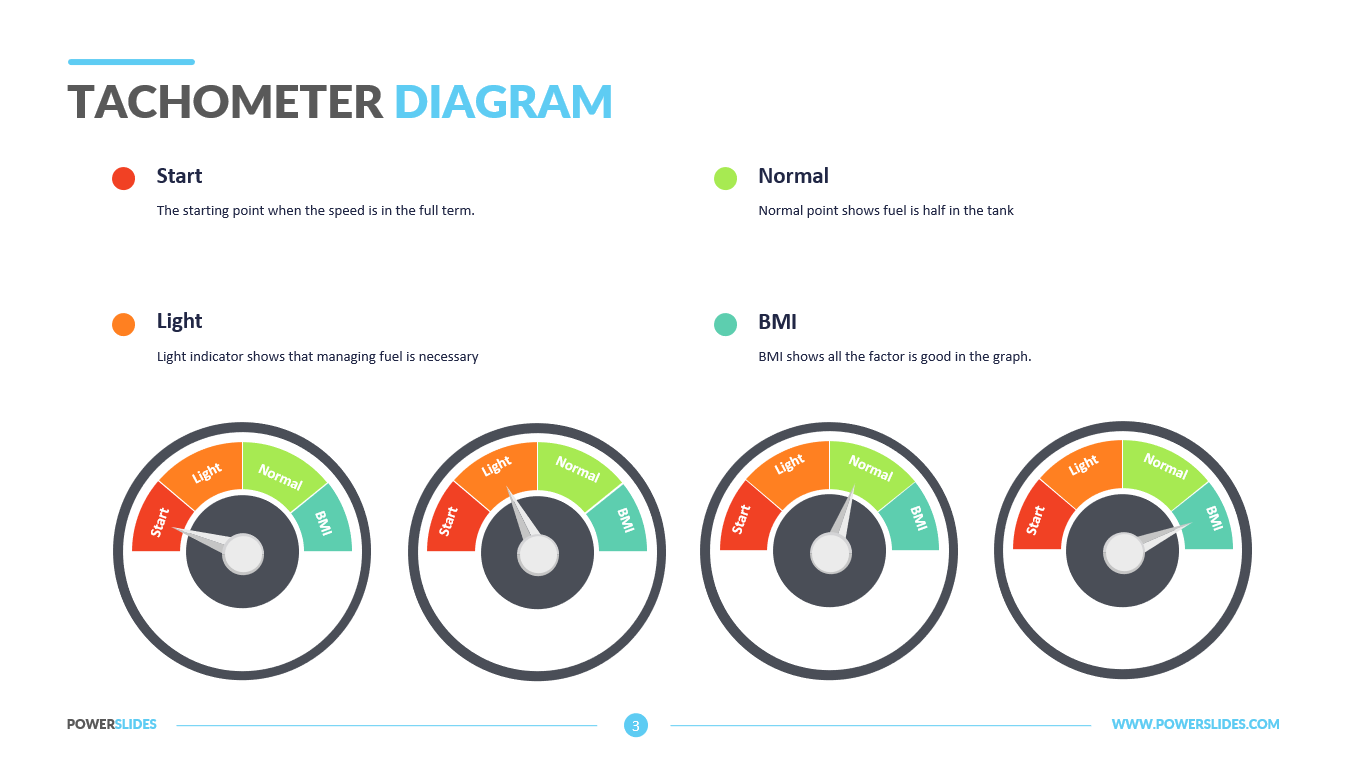
This template is designed to visually present a large amount of financial information using a professional and modern infographic in the form of a speed indicator.
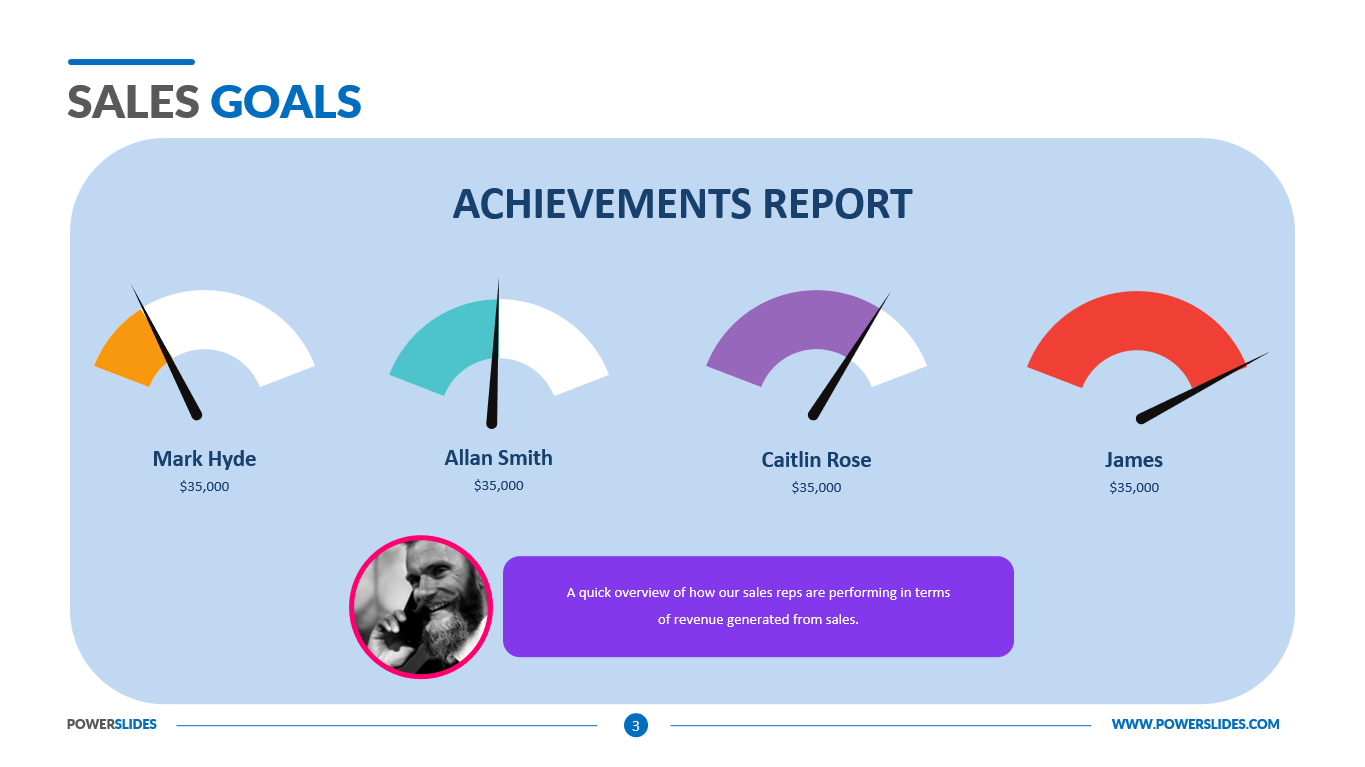
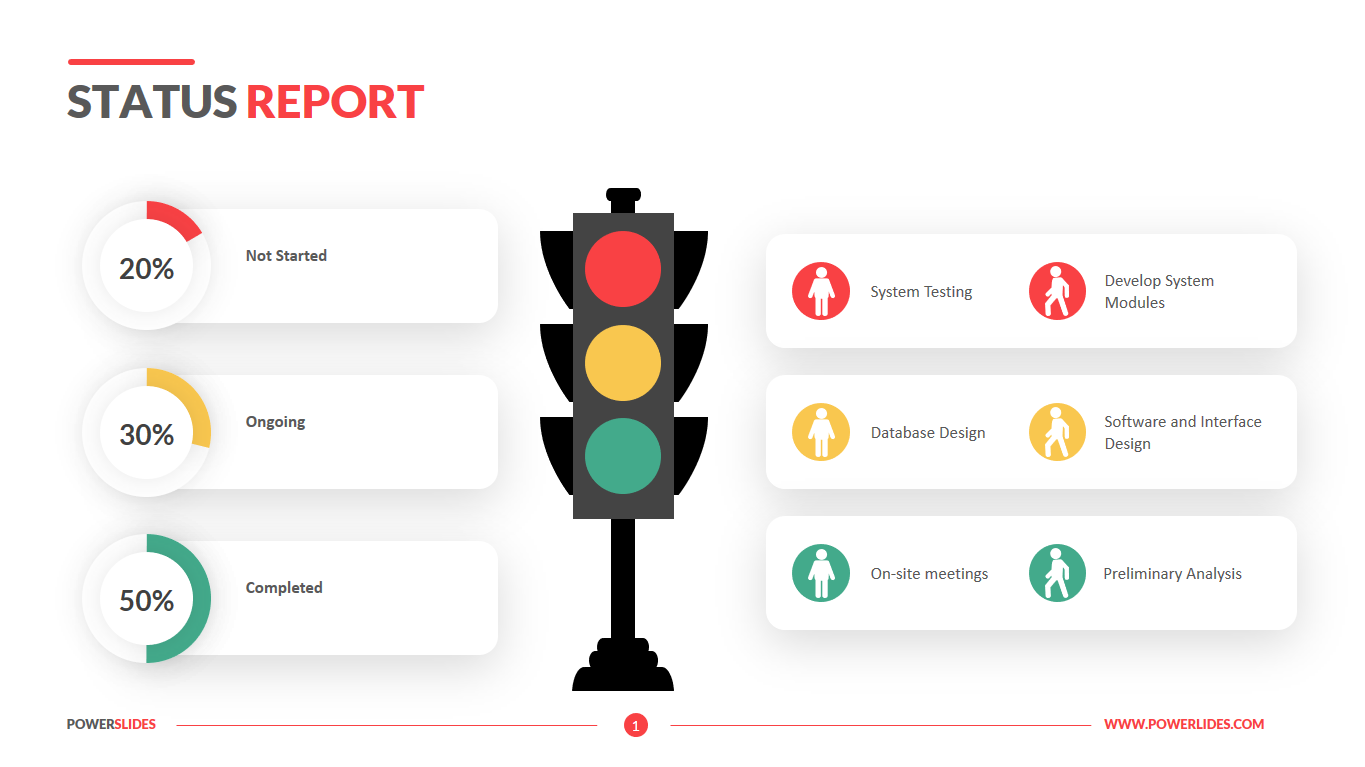
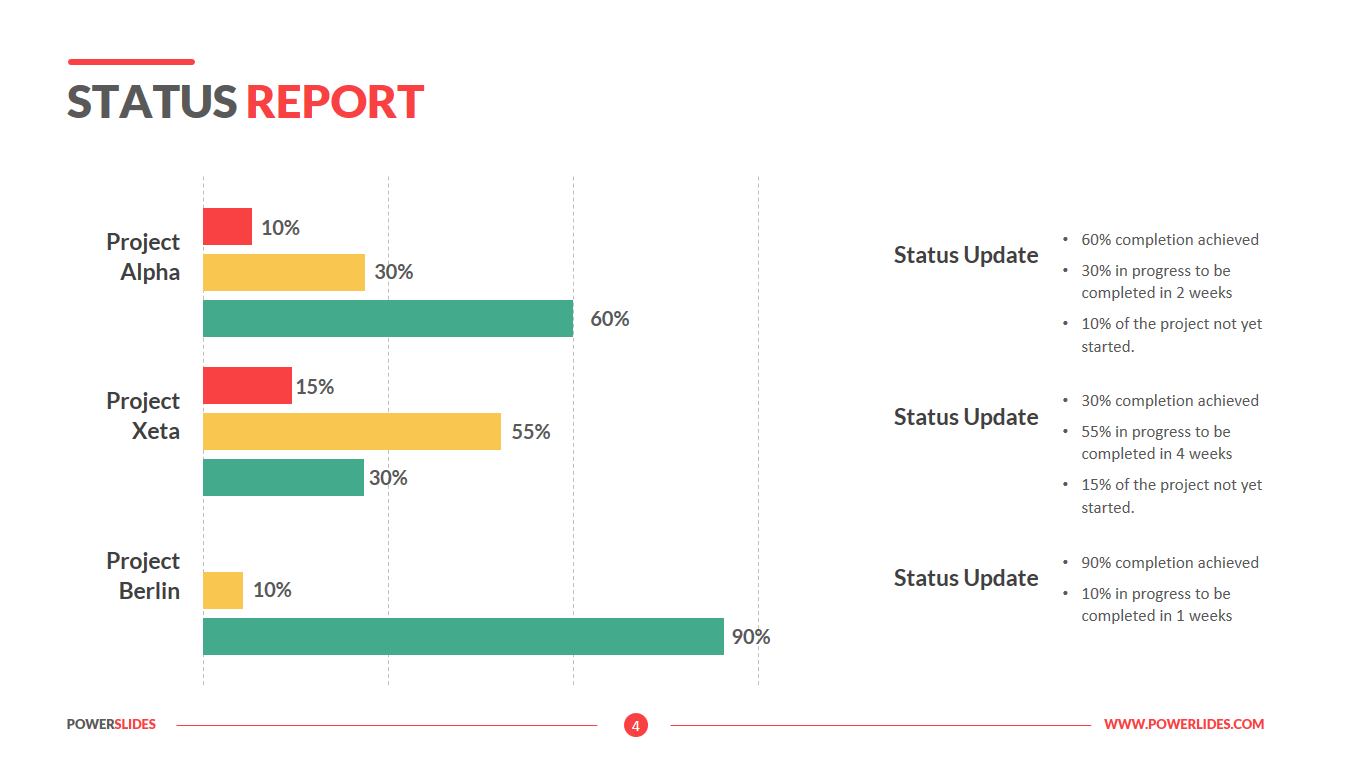
The first slide of this template can be used by project managers in preparation for a team meeting. You can use a speed scale for each stage of your project and detail the main goals or risks for each stage.
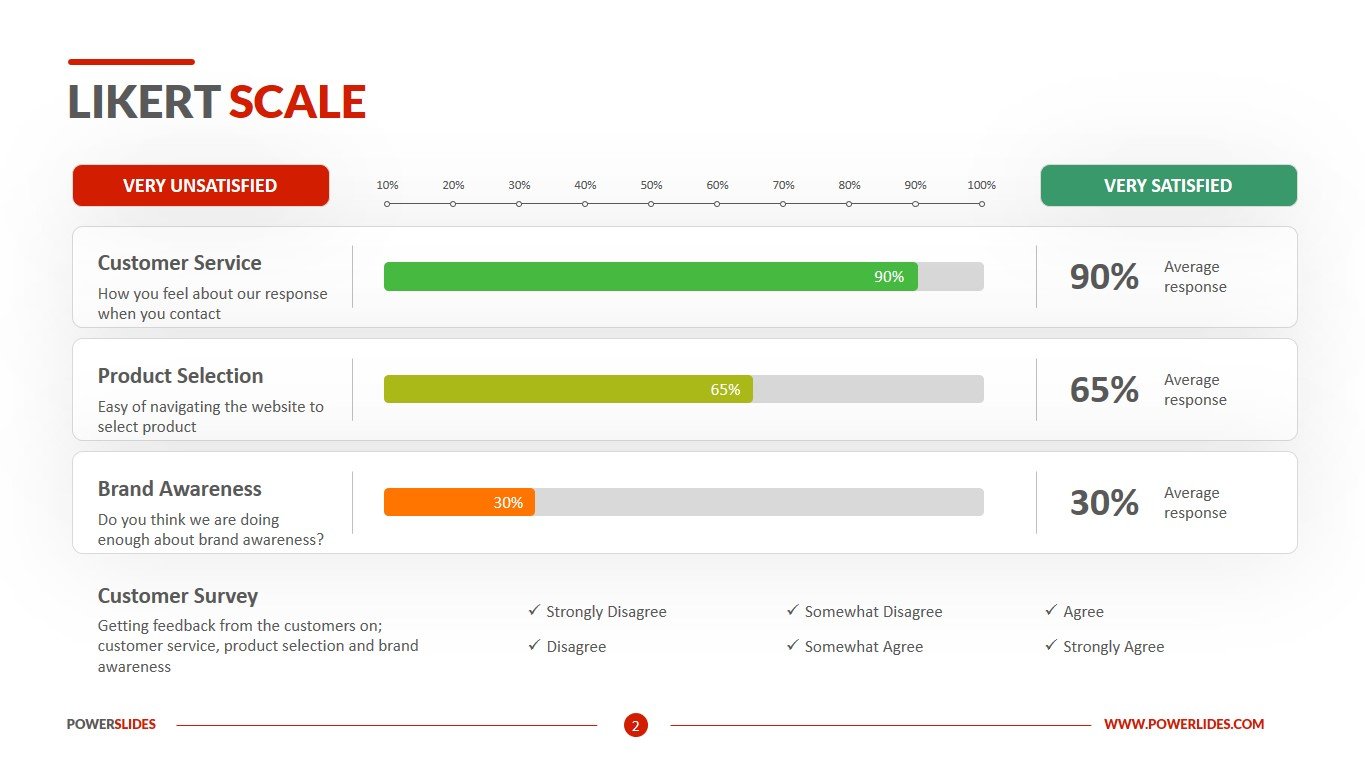
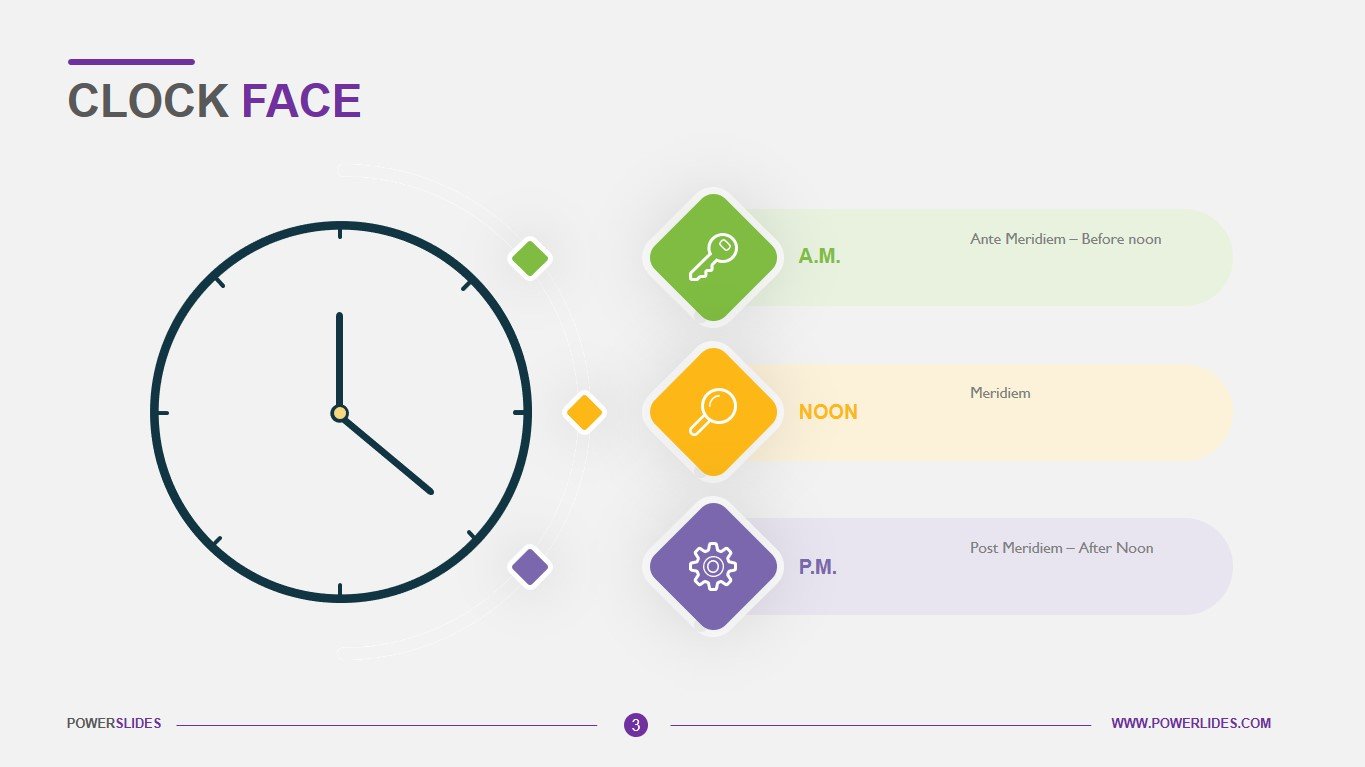
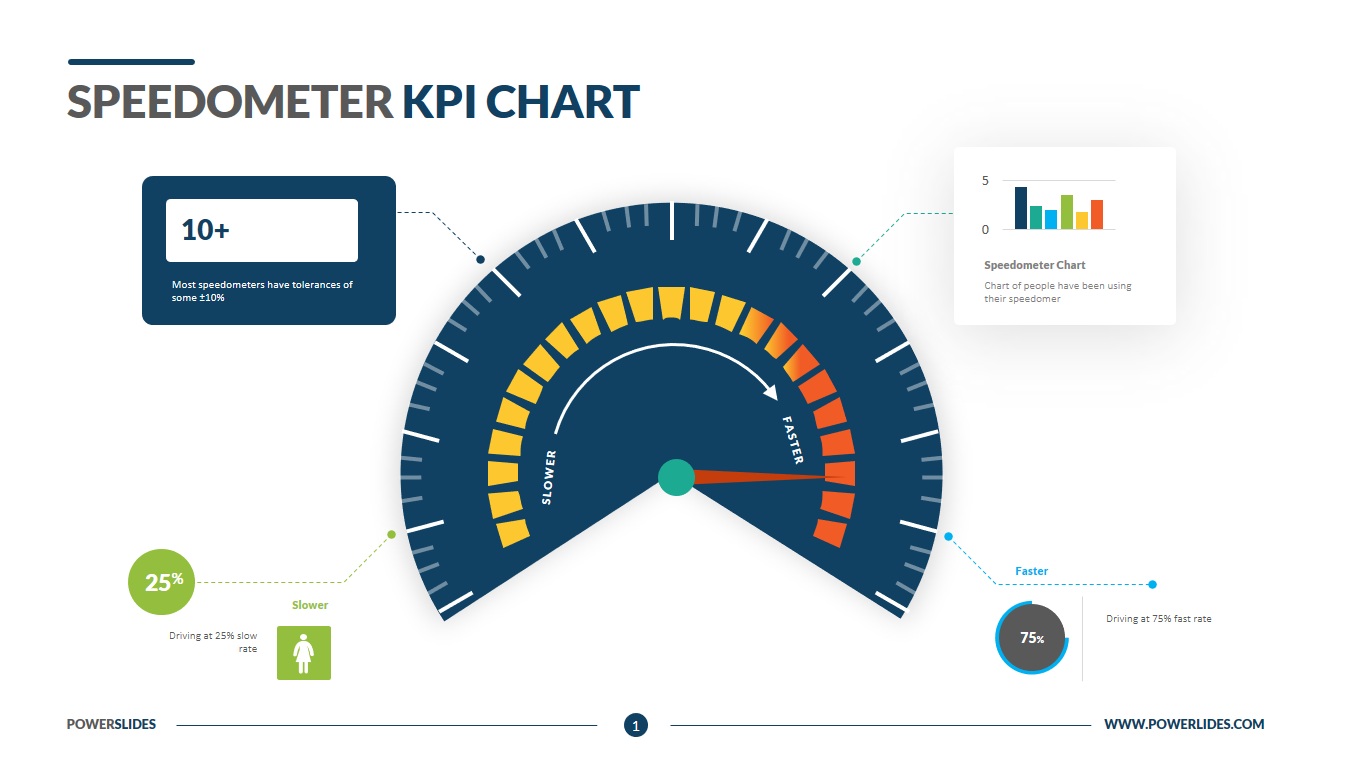
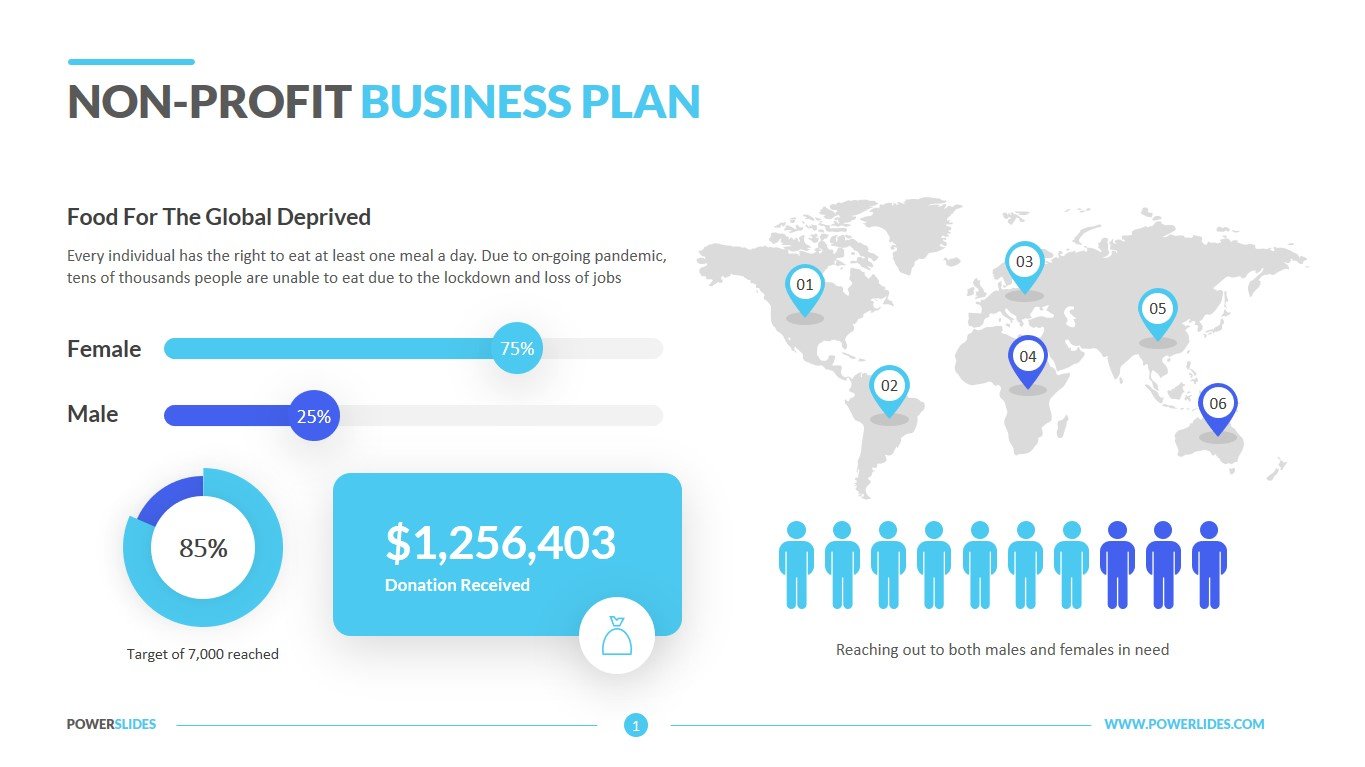
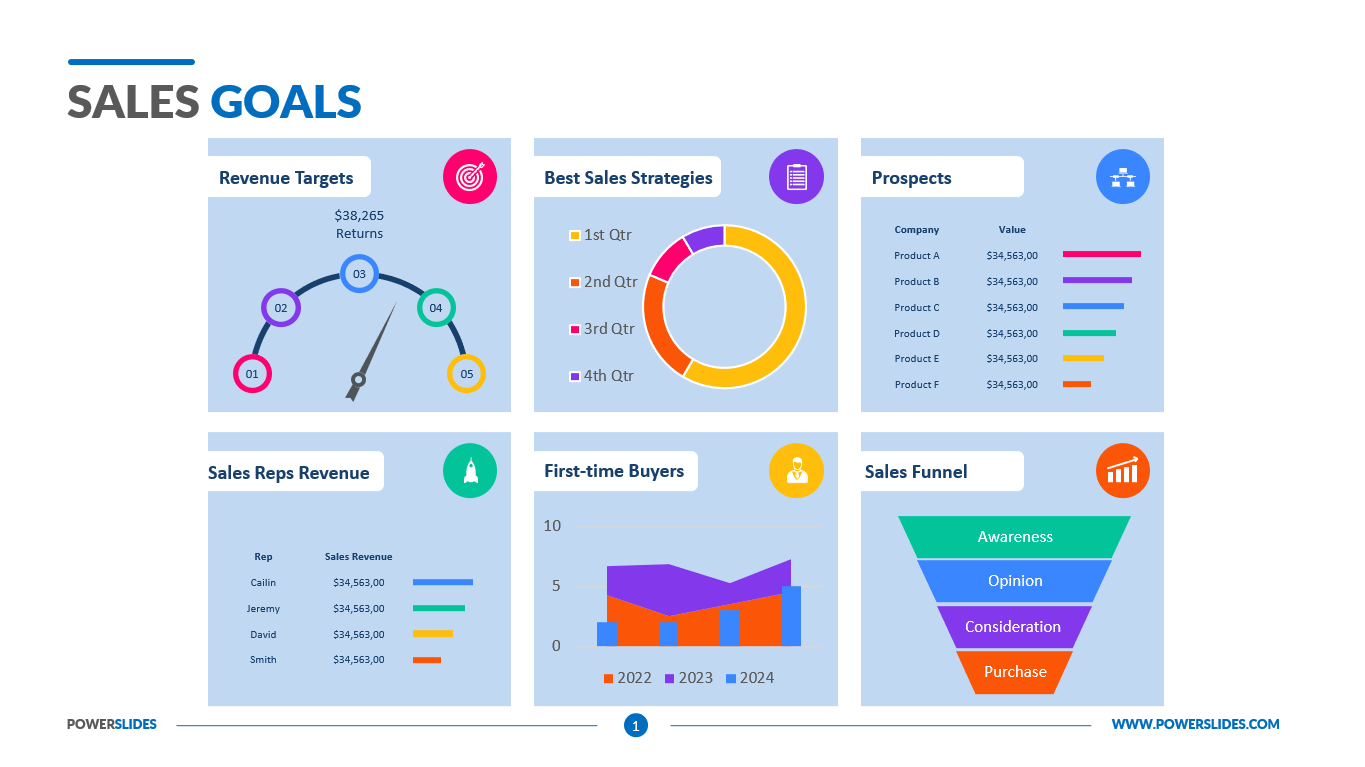
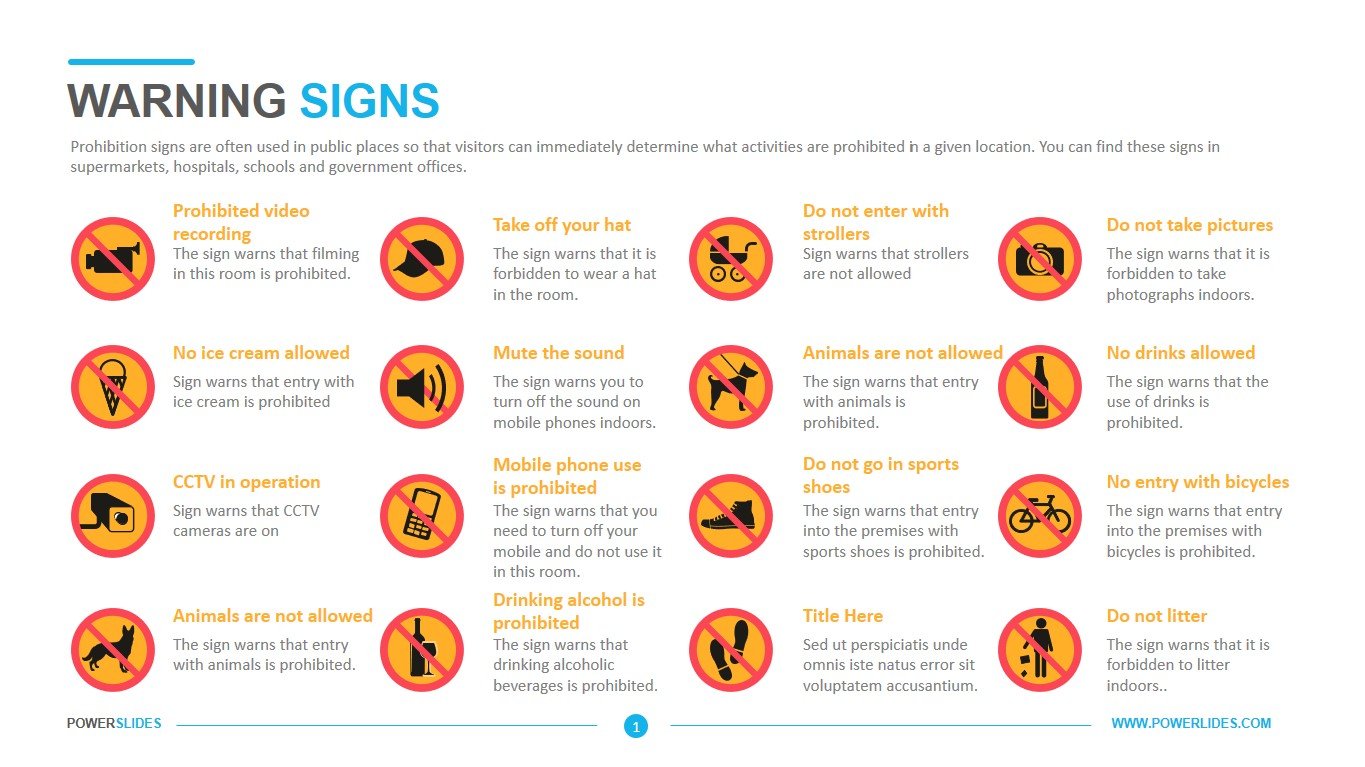
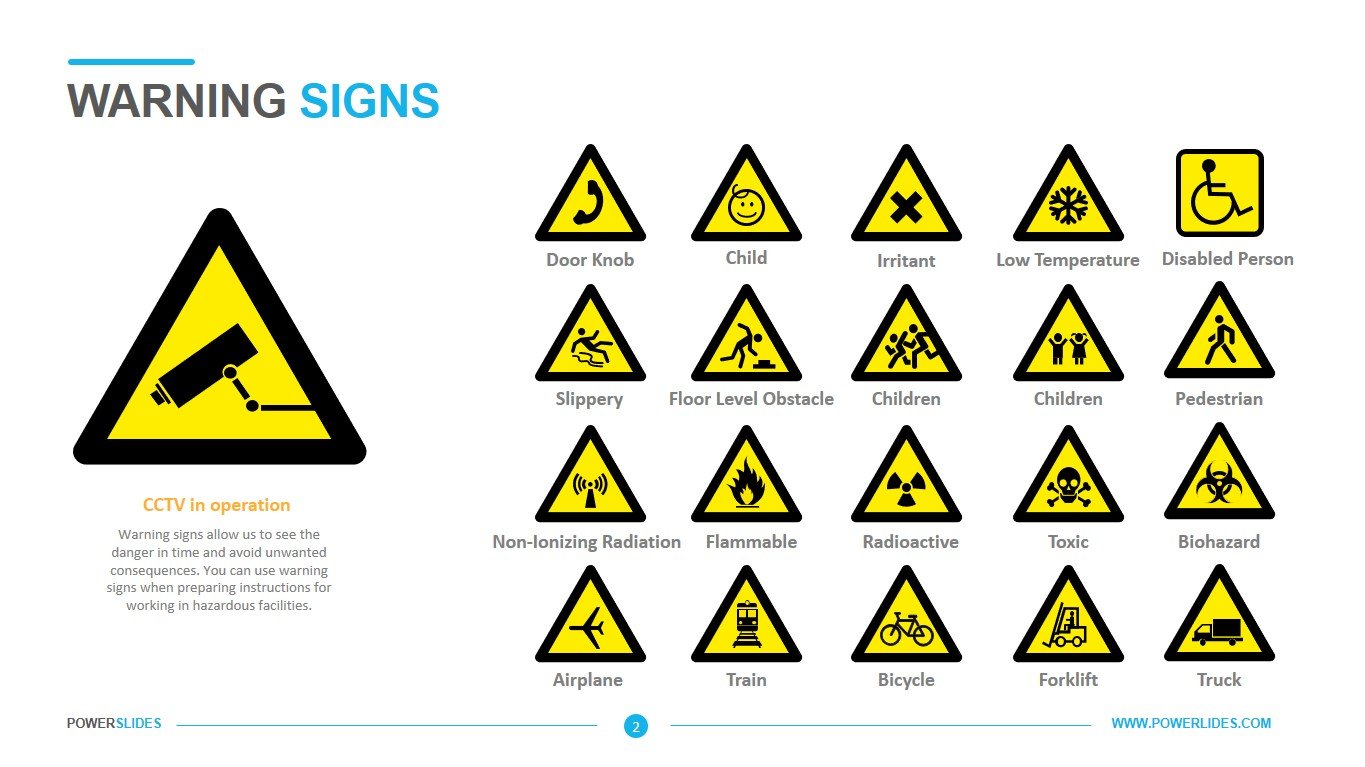
The second slide can be used by financiers and analysts when preparing an analysis of the financial condition of the market. You can represent the return on capital risk for each investment option and describe the potential return and resources required. Also, this slide can be used by labor protection specialists in the preparation of instructions for the safe use of equipment. You can identify the risk areas of the equipment using the infographic on this slide from red to green.
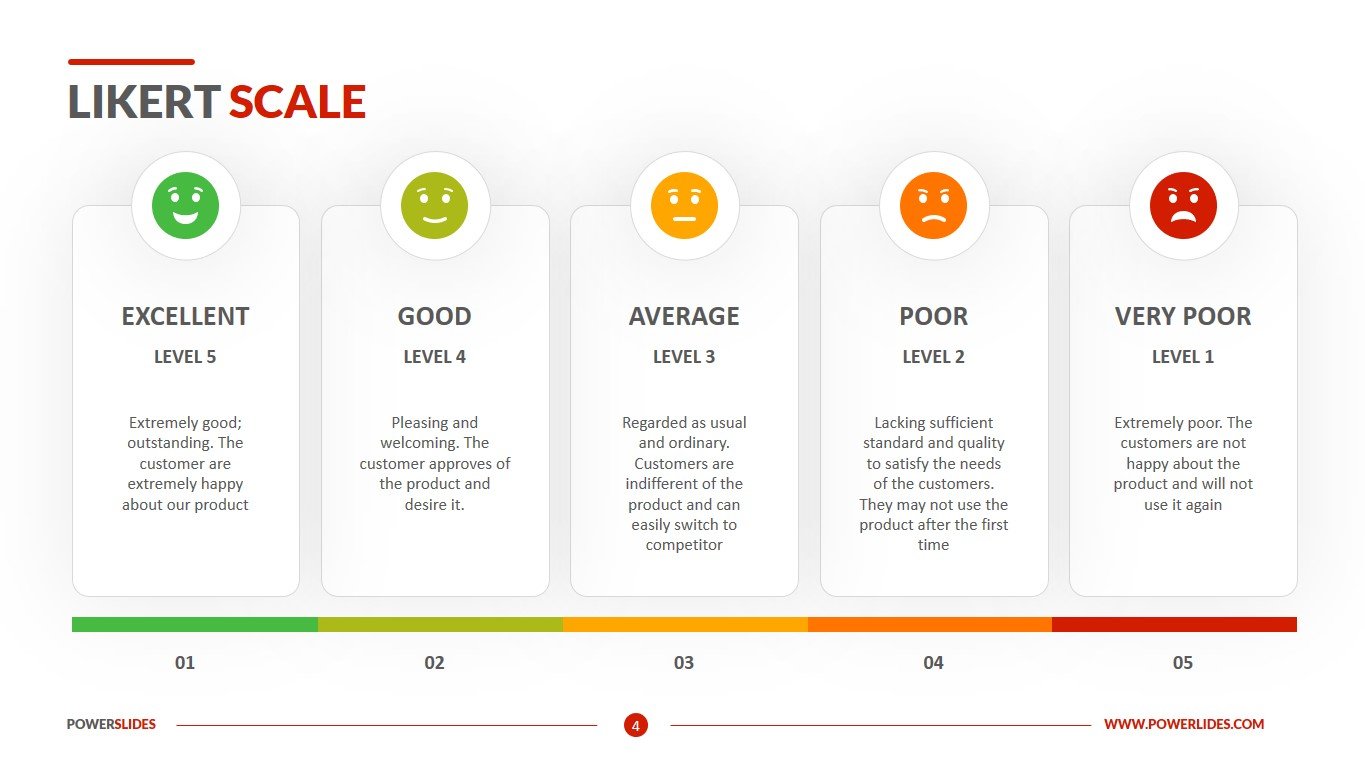
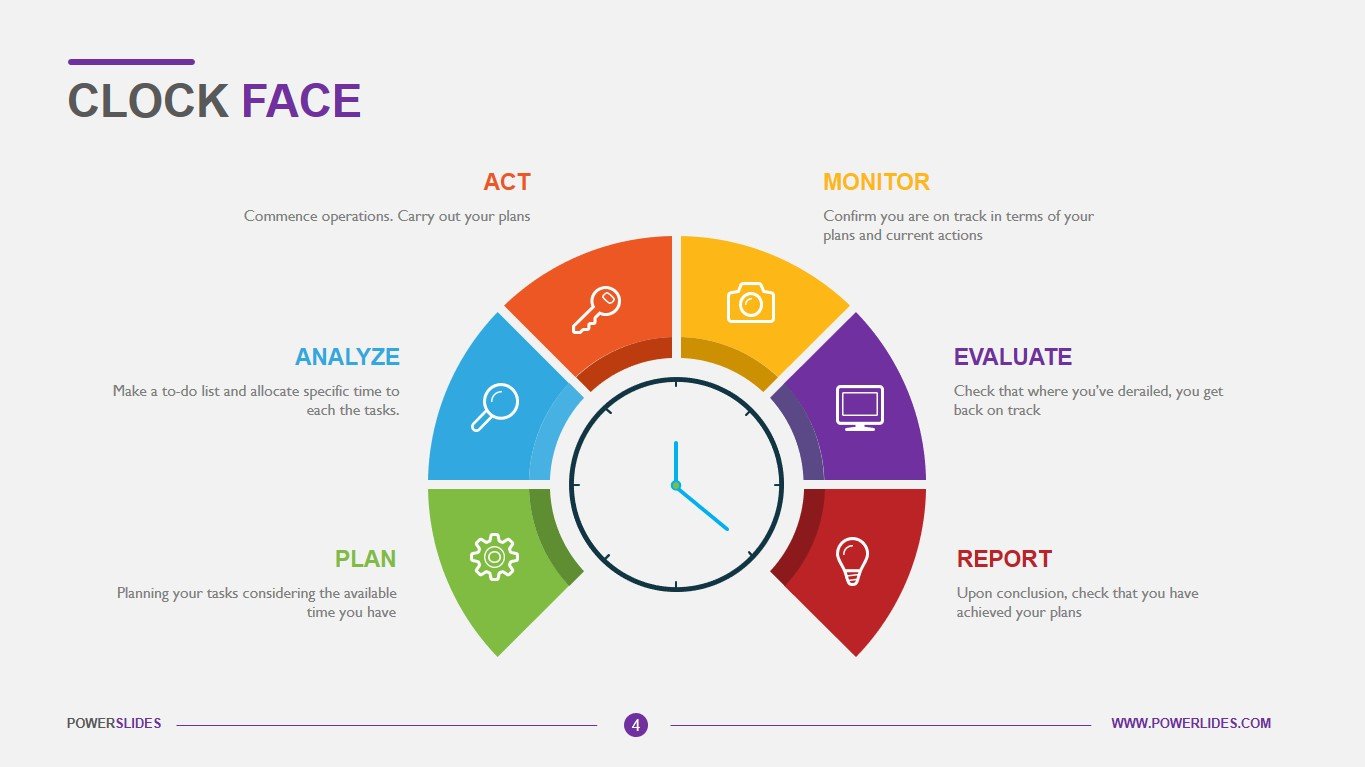
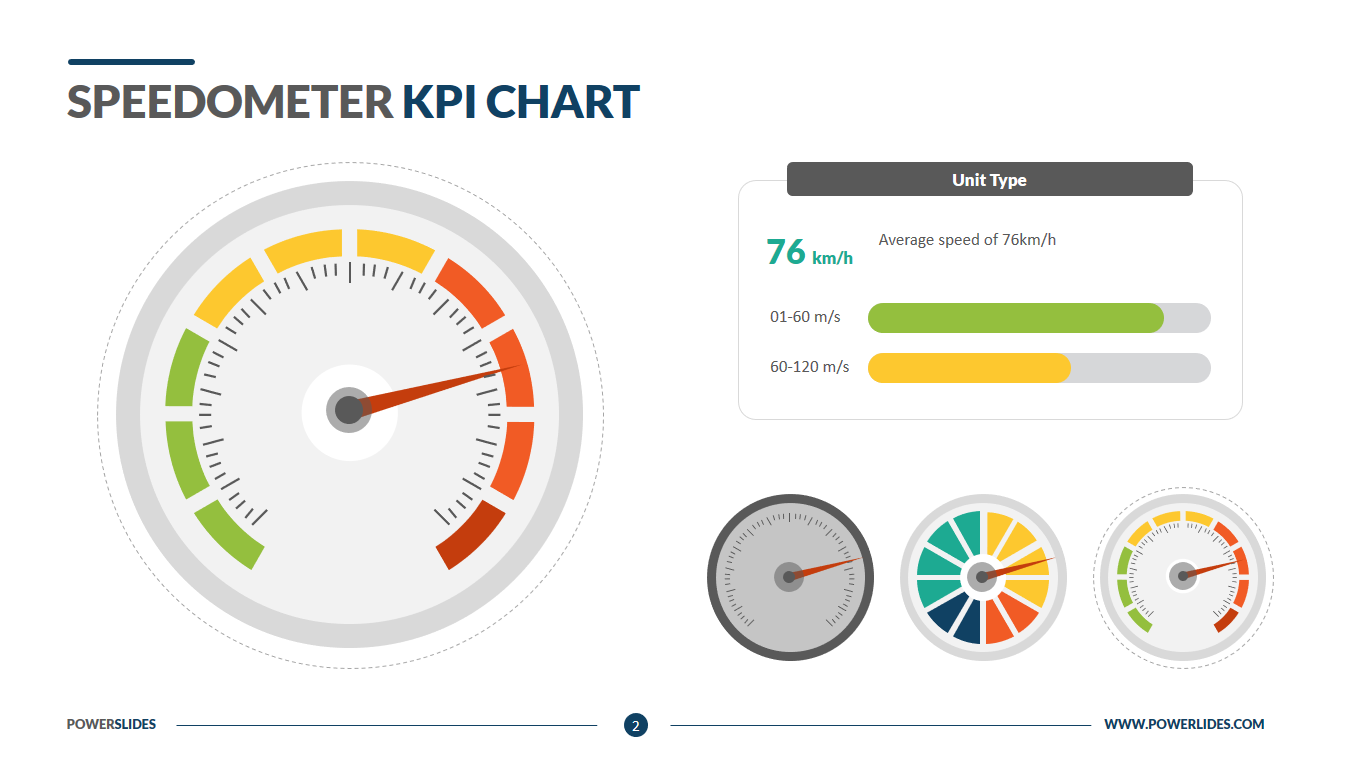
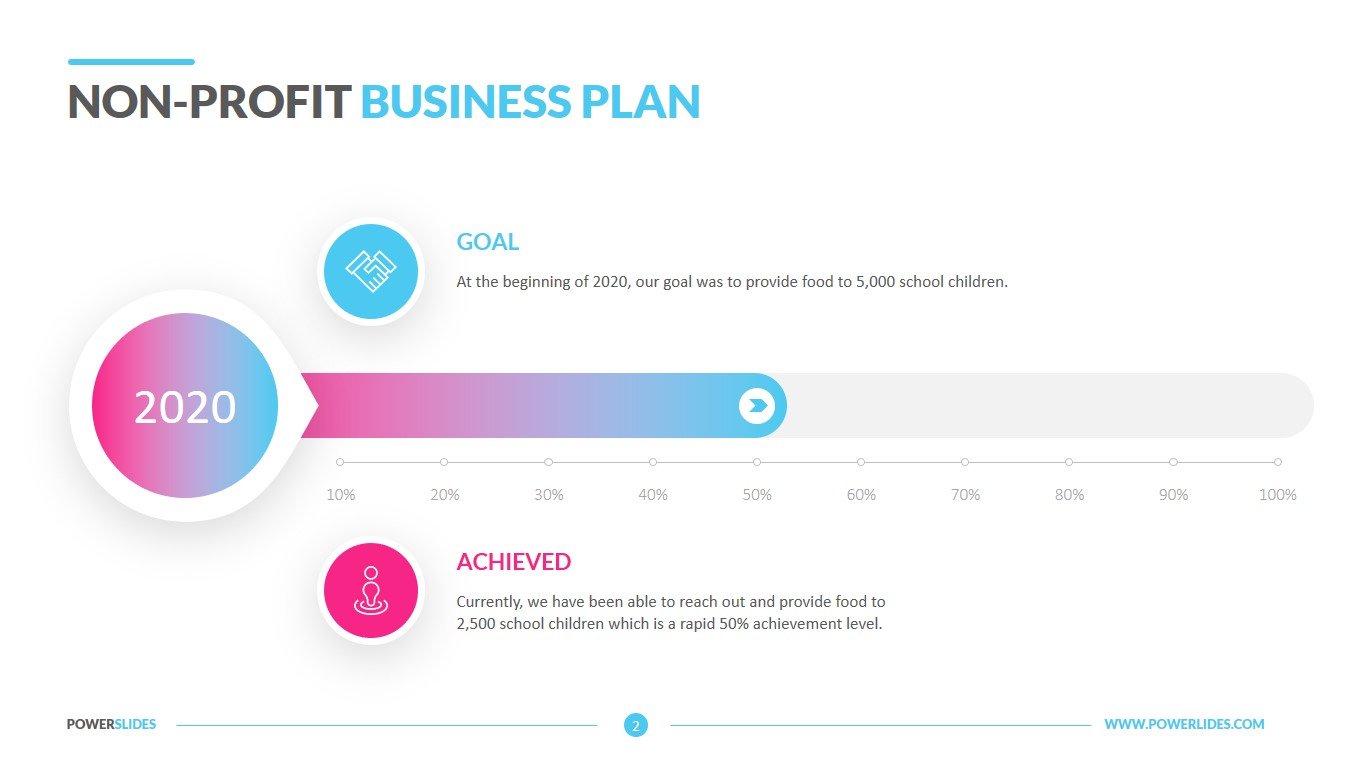
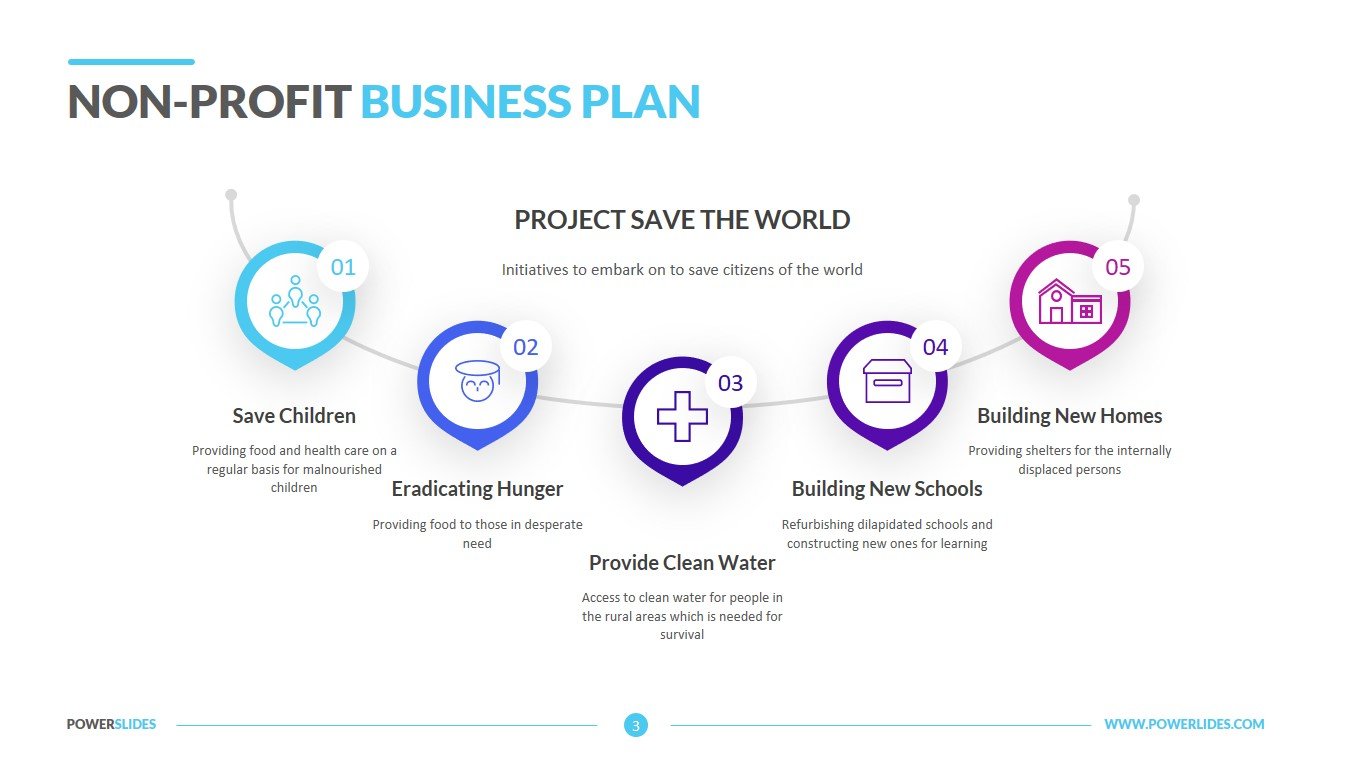
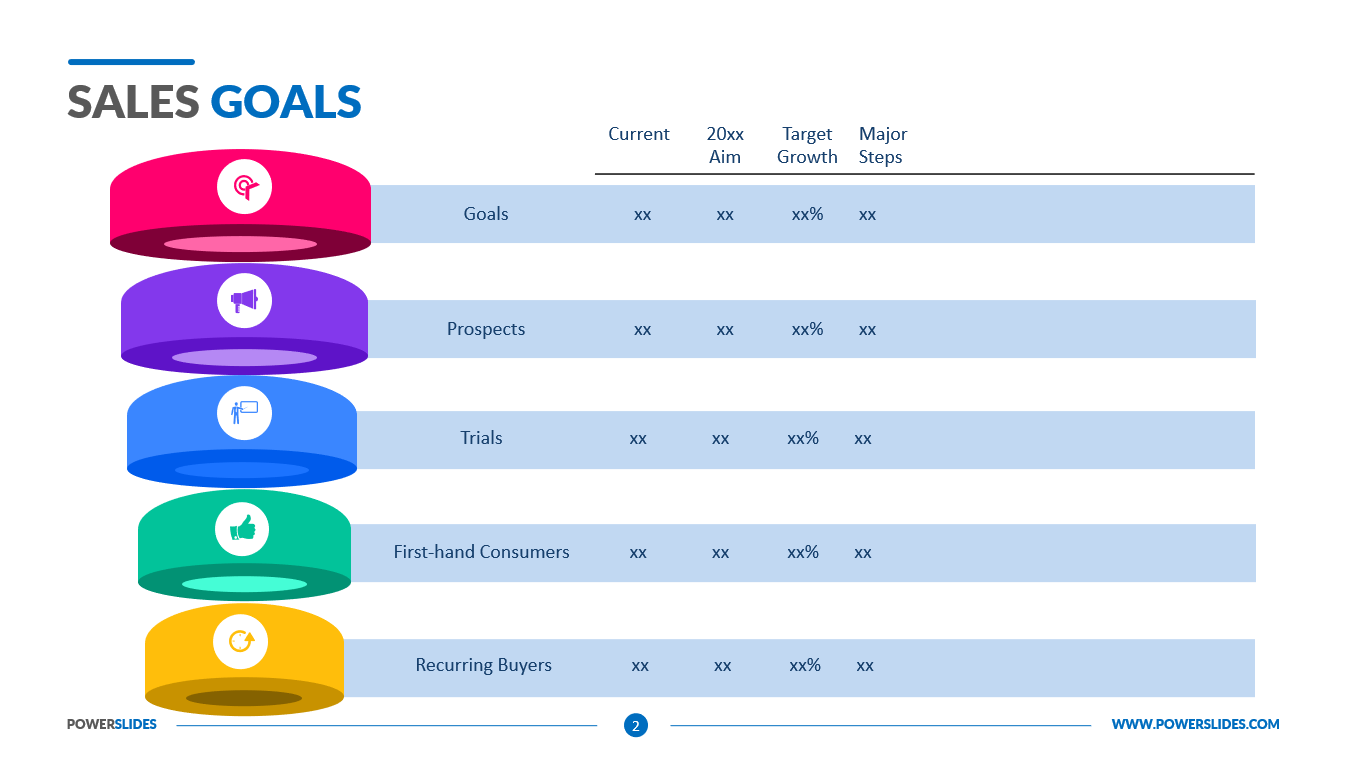
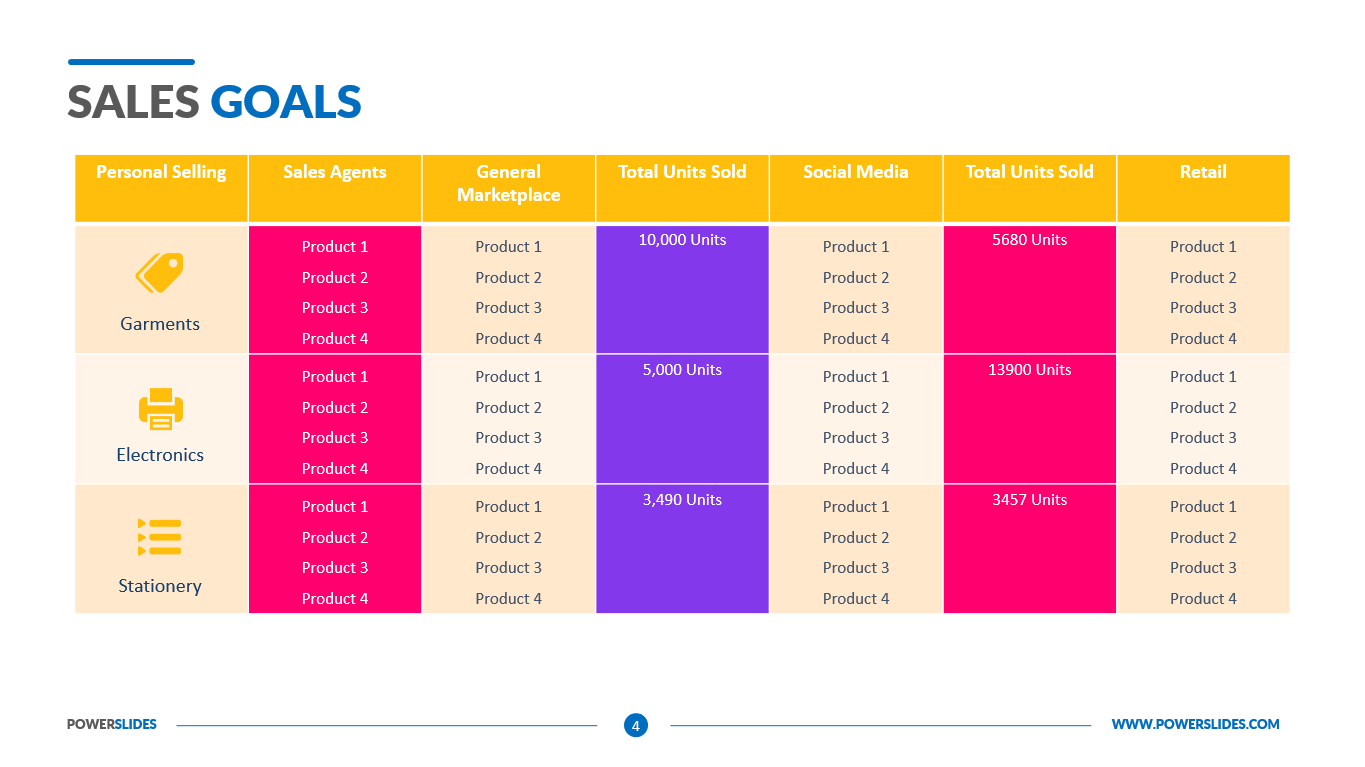
The third slide can be used by marketers when preparing their strategy for promoting a new product to the market. You can specify the stages of the strategy execution and display brief explanations for each stage. Also, startups can use this template when preparing for a meeting with investors. You can define the main markets for a product or categories of potential buyers.
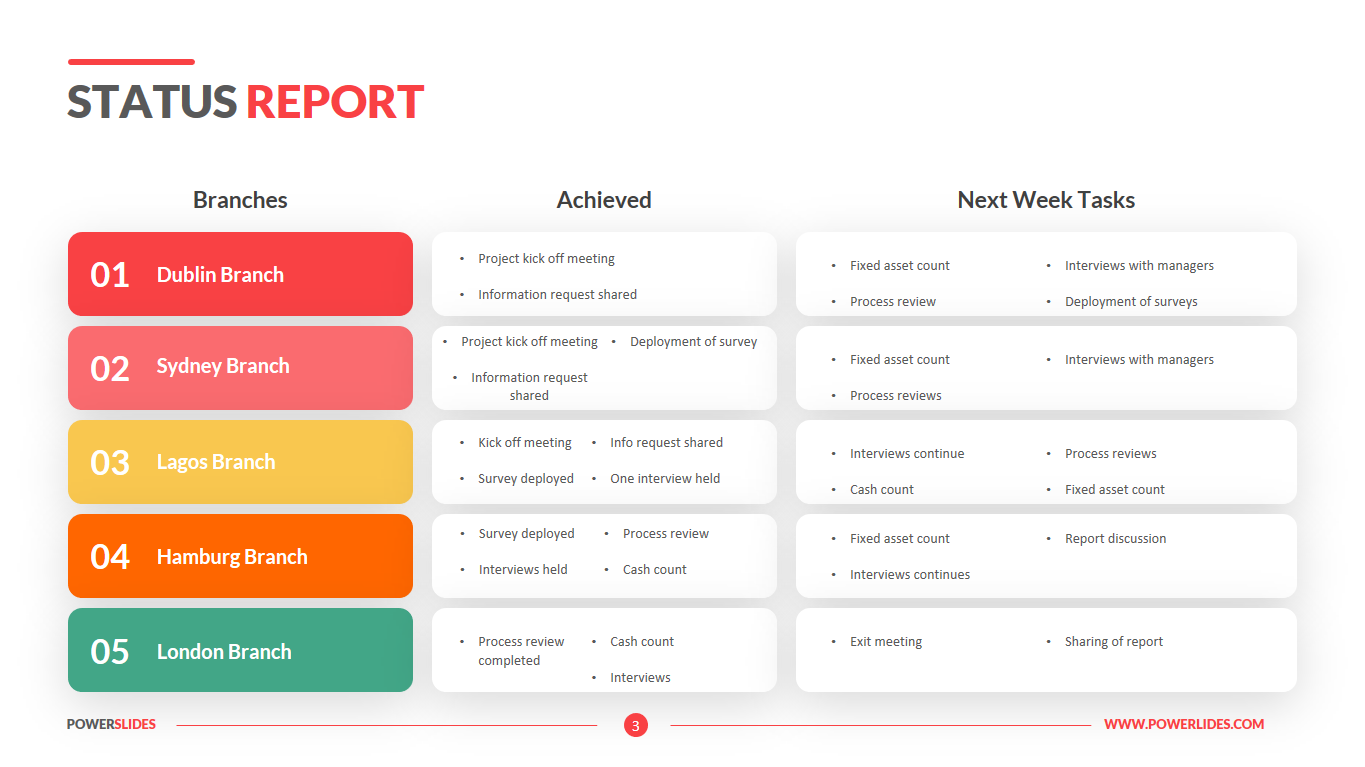
Team leaders can use the slides in this template in preparation for their weekly sprints with software developers. You can visually display the progress of each sprint and overall project progress using the infographic in this template.
Business trainers and university educators can use the slides from this template to prepare their courses on ROI or project management. The slides in this template can be used by department leaders to prepare reports on various projects in the company. Teachers can use this template when preparing student performance information.
Tachometer Diagram Template is a stylish and professional template that contains four slides. All slides in the template can be easily customized to suit your corporate color requirements. You can independently change the font size and type, position and color of the infographic. Tachometer Diagram Template will be useful for heads of banks and investment companies, directors of startups and economists. This template’s slides will be a great addition to your professional presentation collection.


