Sales Report Template
What do you think of this template?
 (5.00/ 5)
5 ratings

 4 Slides
 File size: 16:9
 Fonts: Lato, Calibri
  Supported version
PPT 2010, PPT 2013, PPT 2016
Supported version
PPT 2010, PPT 2013, PPT 2016

Product details
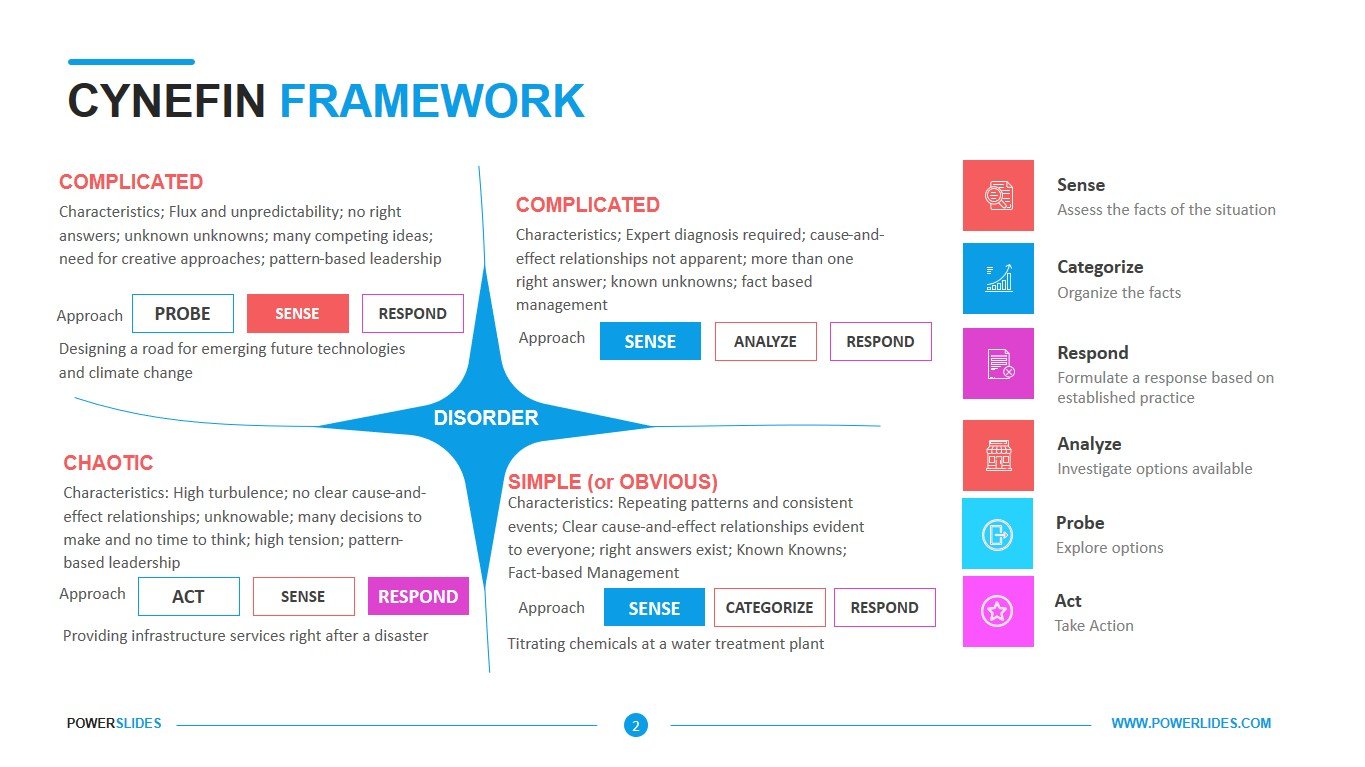
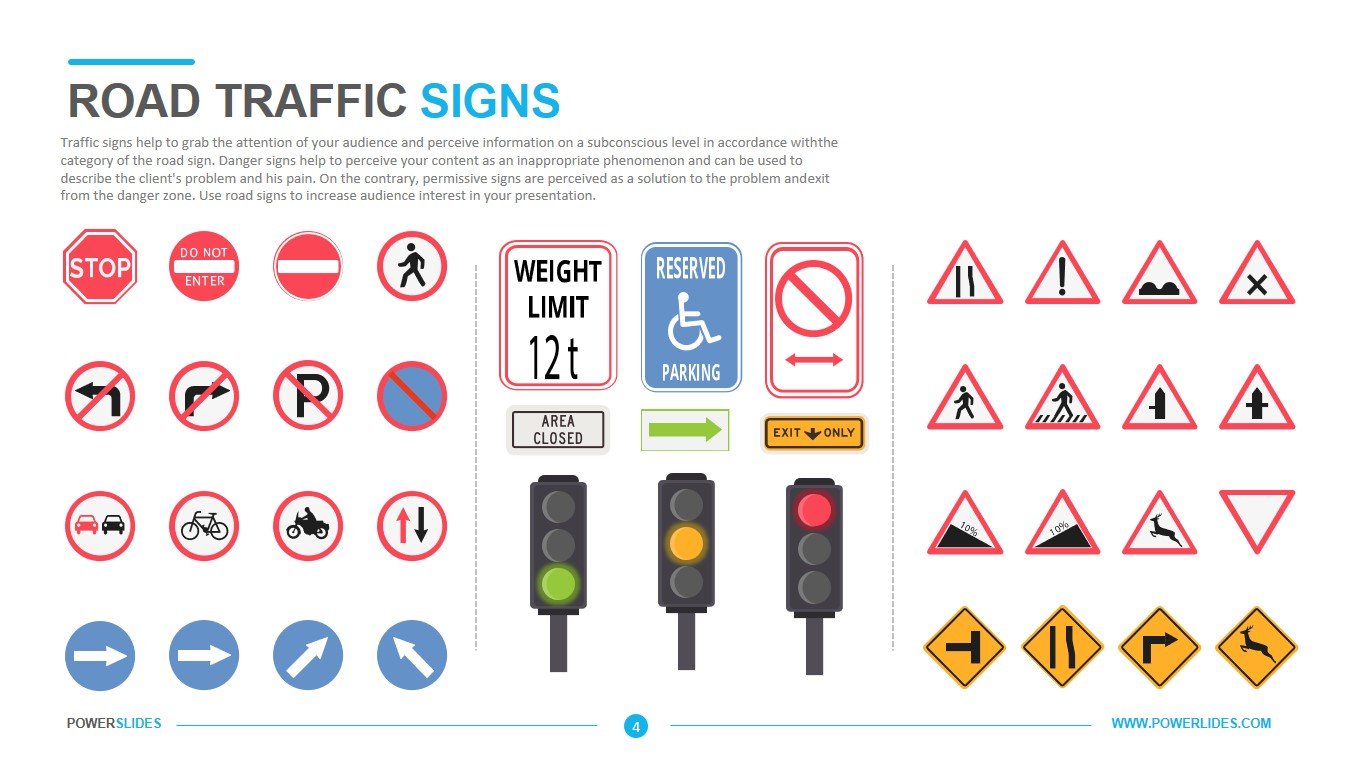
A sales report, or sales analysis report, gives an overview of the state of the sales activities within a company. It shows the different trends happening in the sales volume over a certain time, but also analyzes the different steps of the sales funnel and the performance of sales executives. They give a snapshot of the company’s exercise at a specific moment in time to assess the situation and determine the best decision to make and the type of action to undertake. These reports help in finding potential new market opportunities where they could improve the results by using modern sales reporting software. There are also different variations of reports that will focus on different aspects: the sales performance in general, detailing the revenue generated, the sales volume evolution, measuring it against the sales target pre-set, the customer lifetime value.
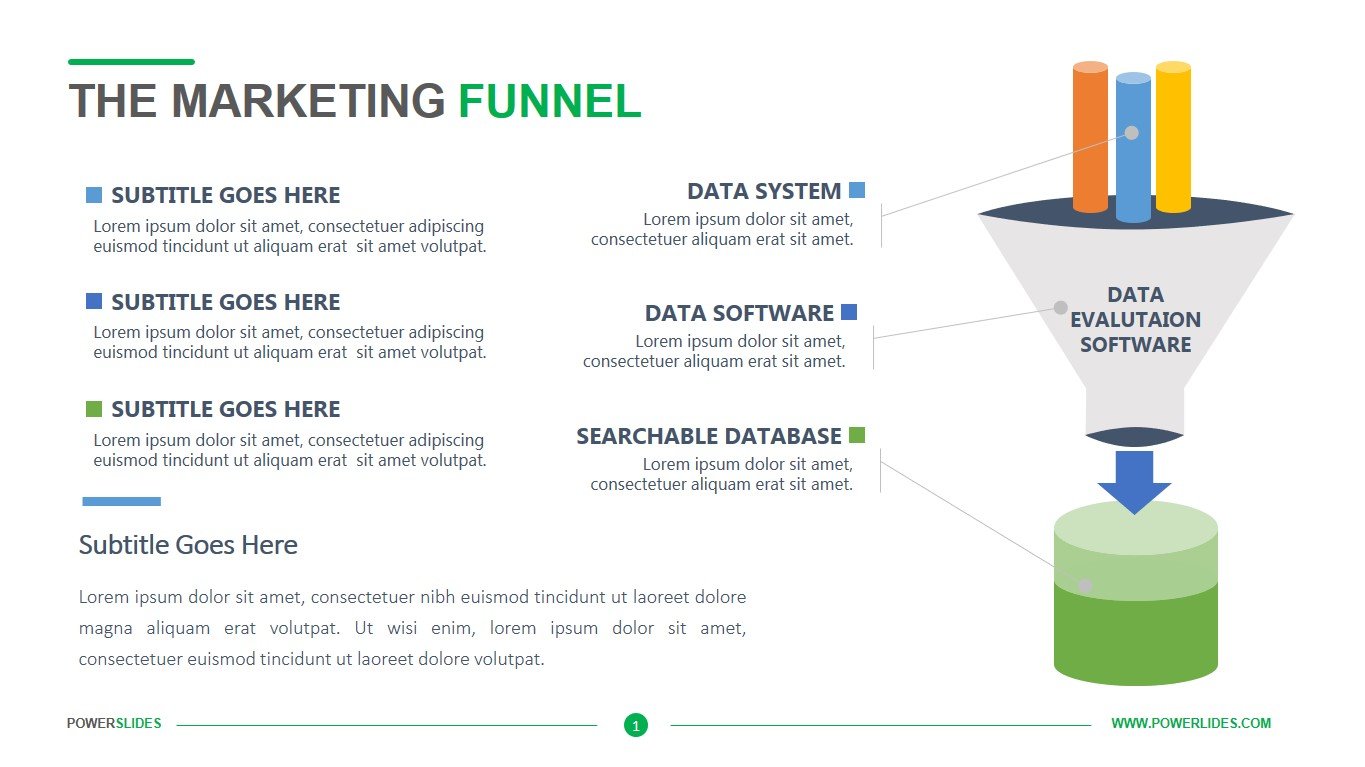
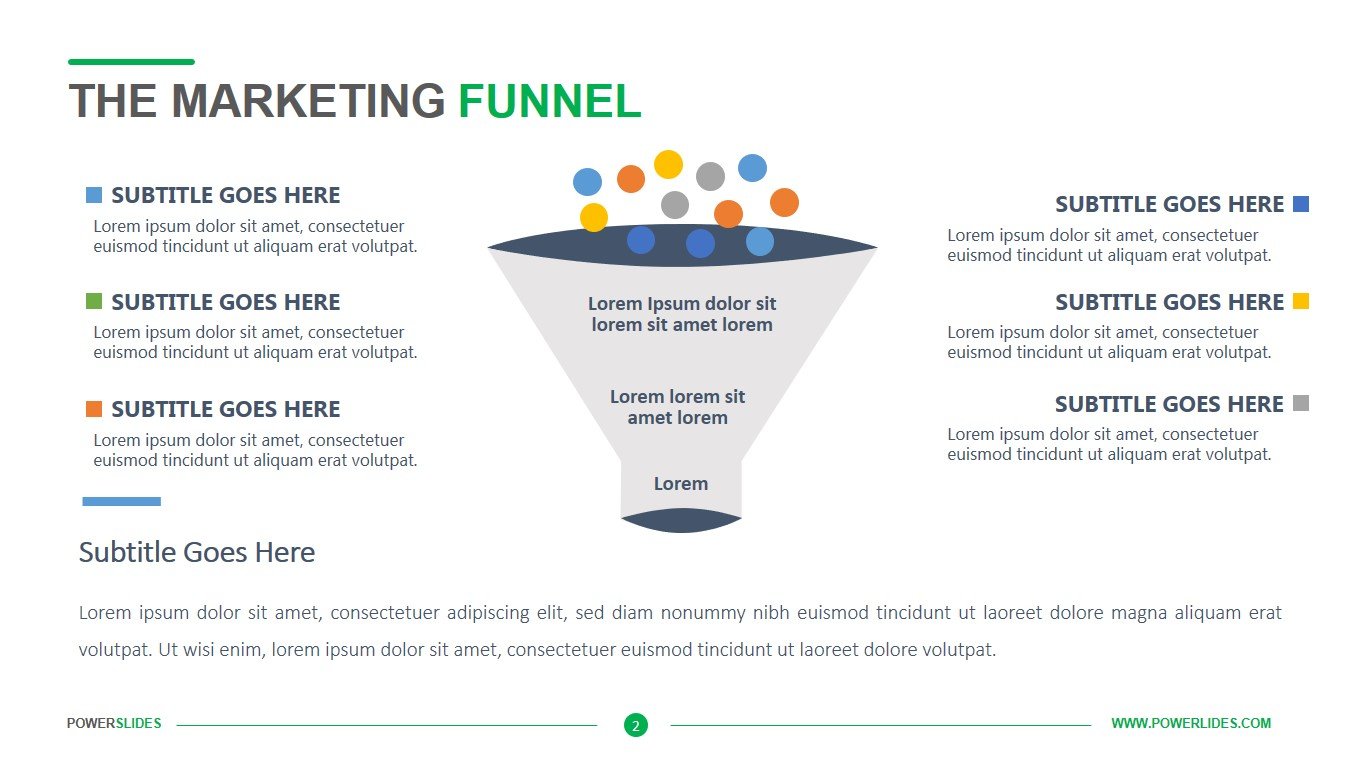
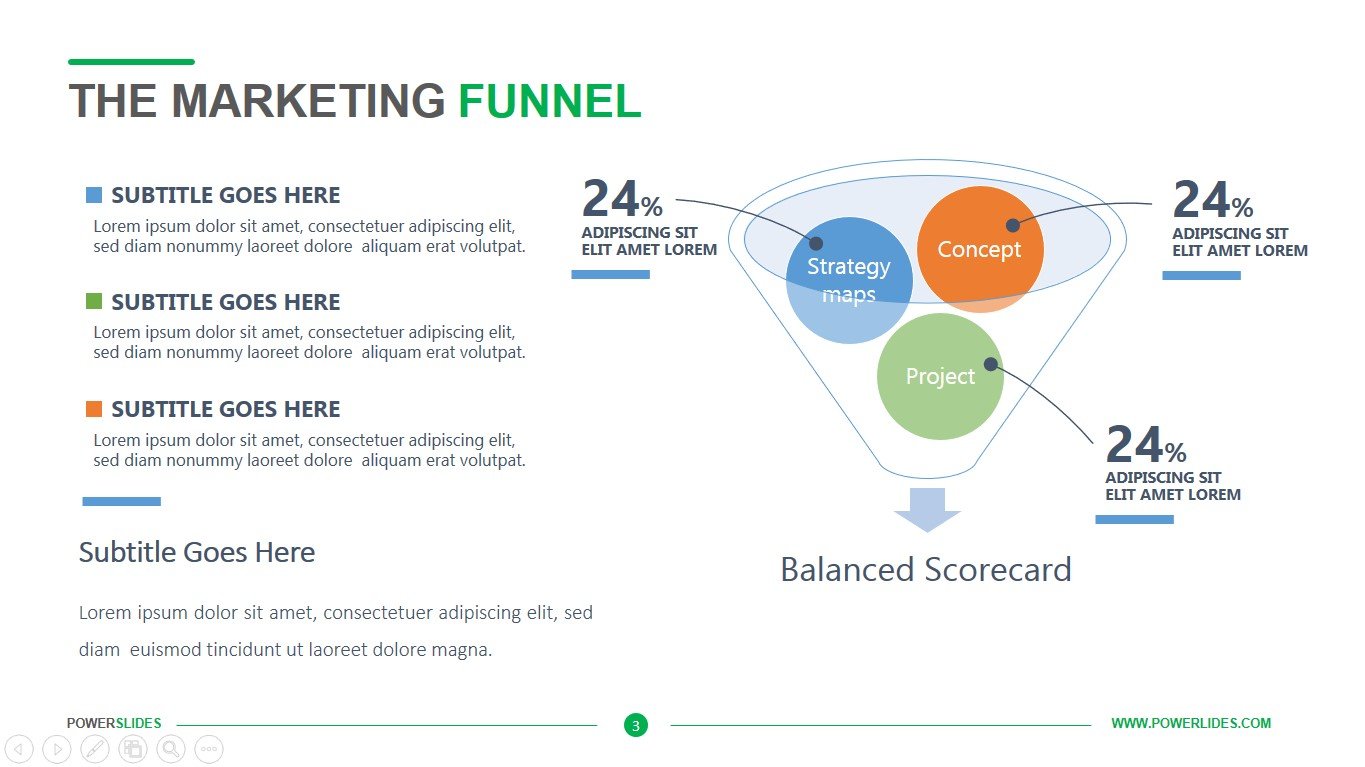
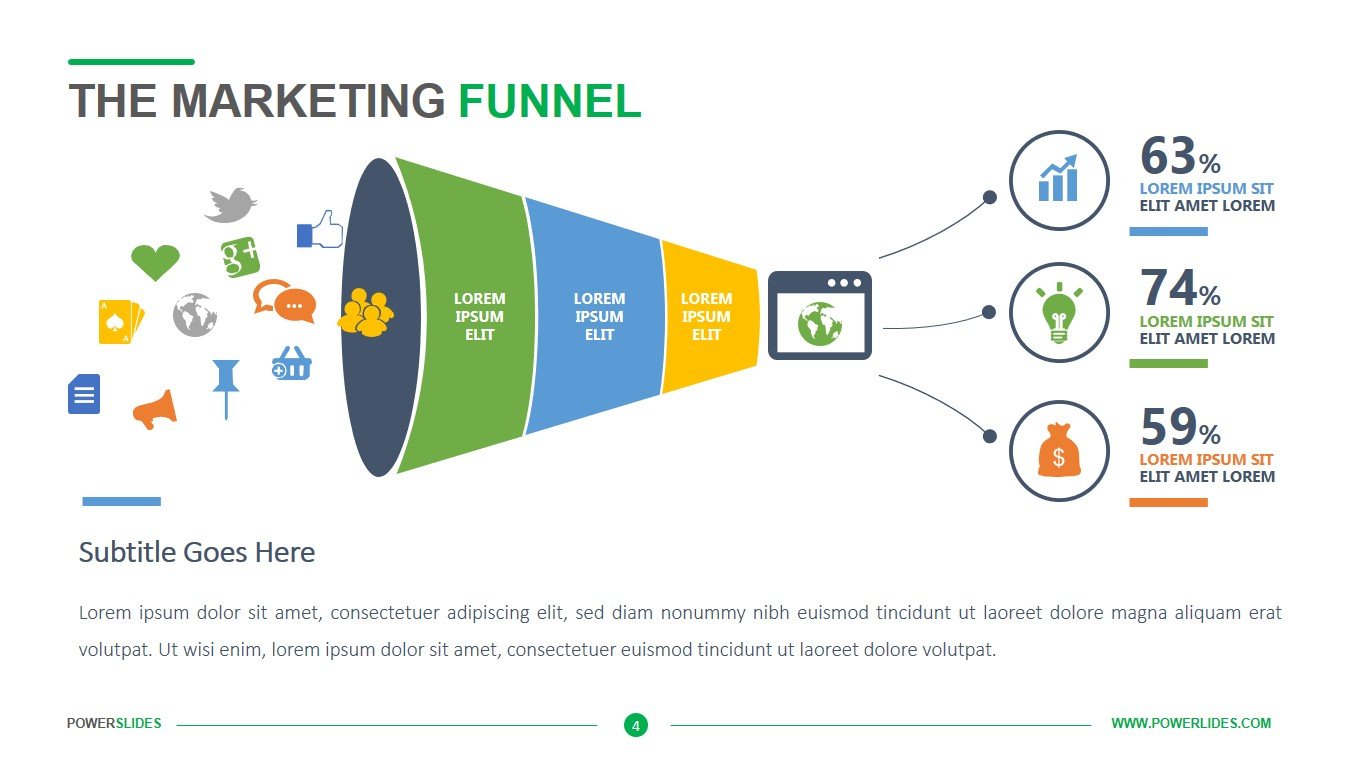
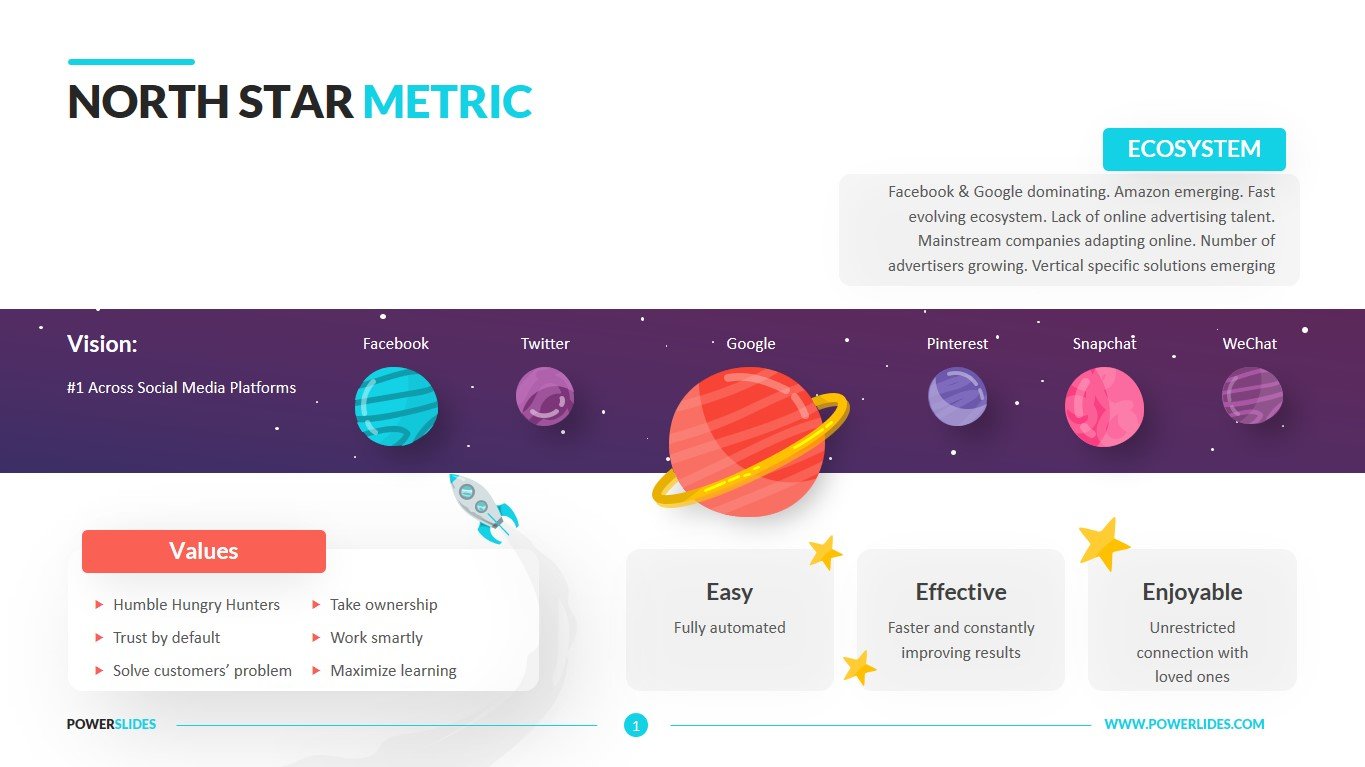
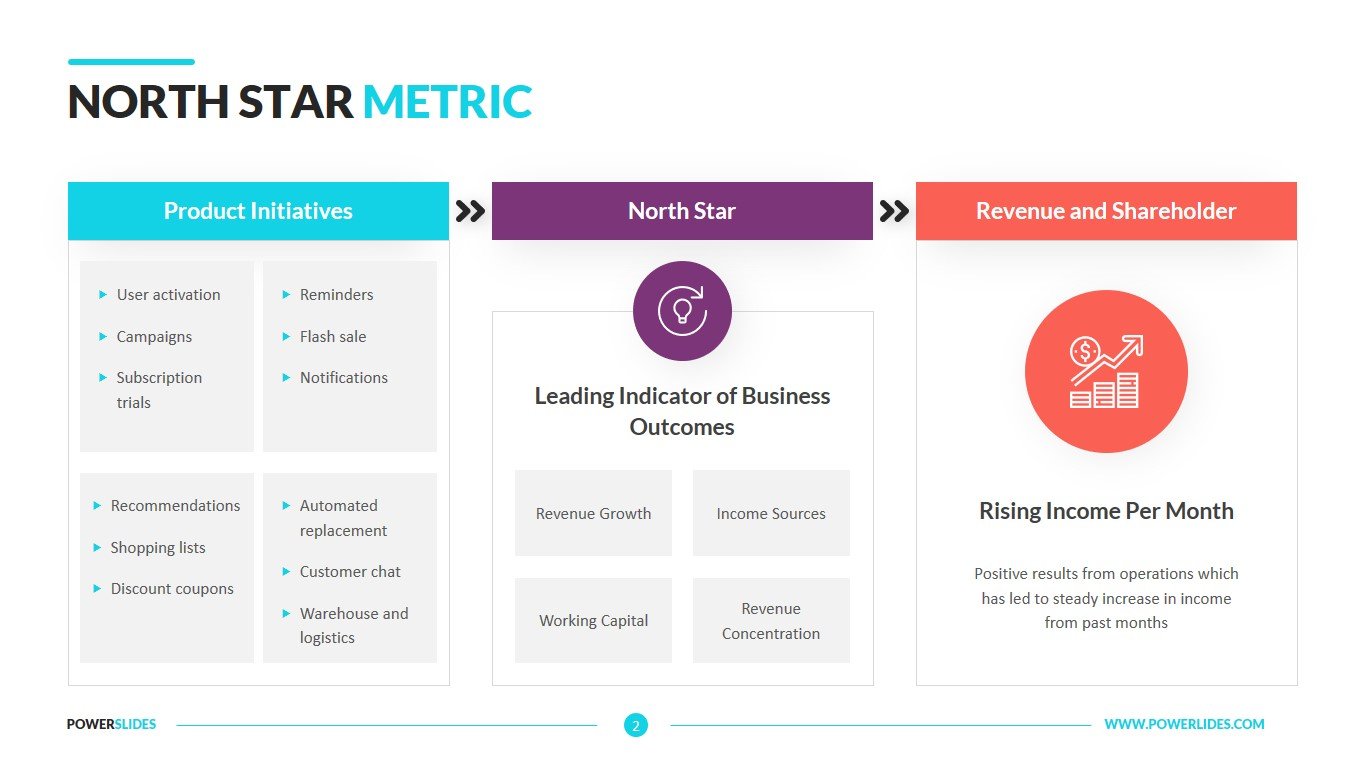
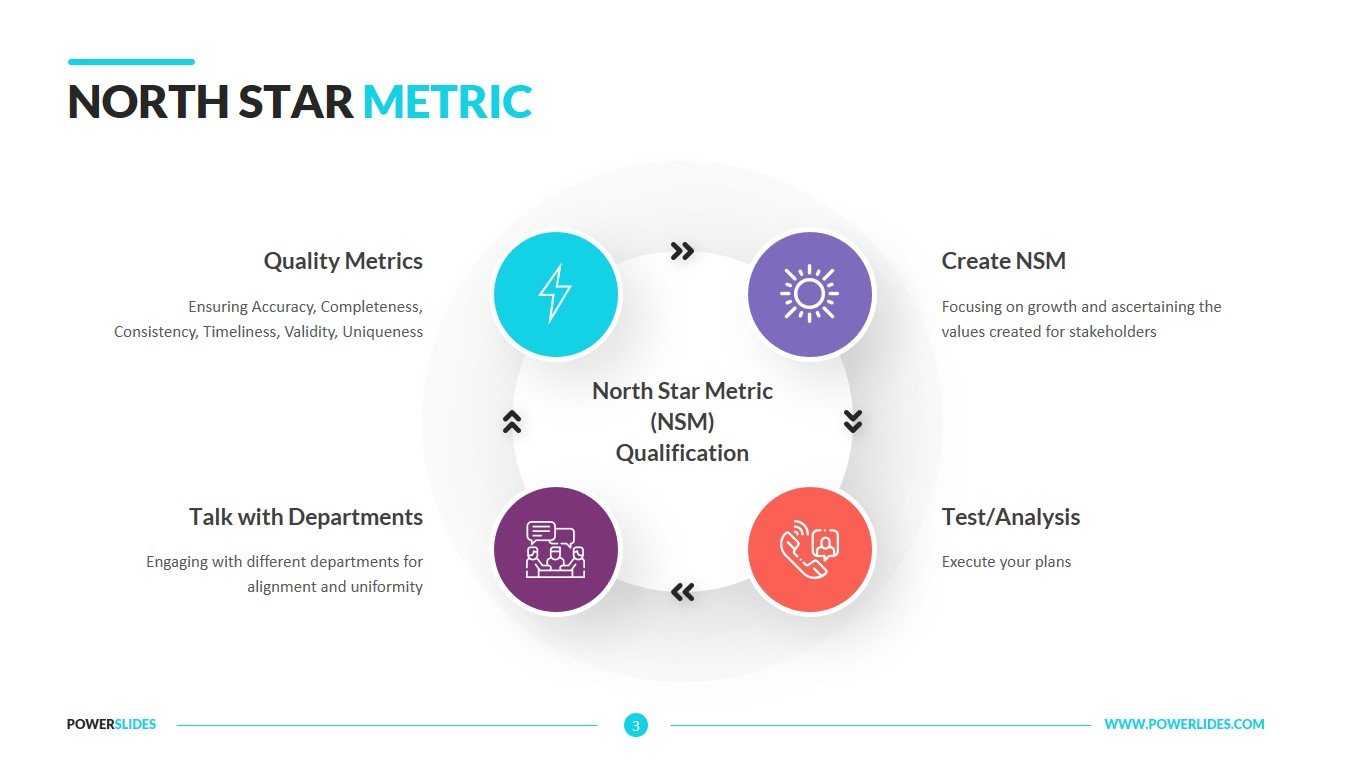
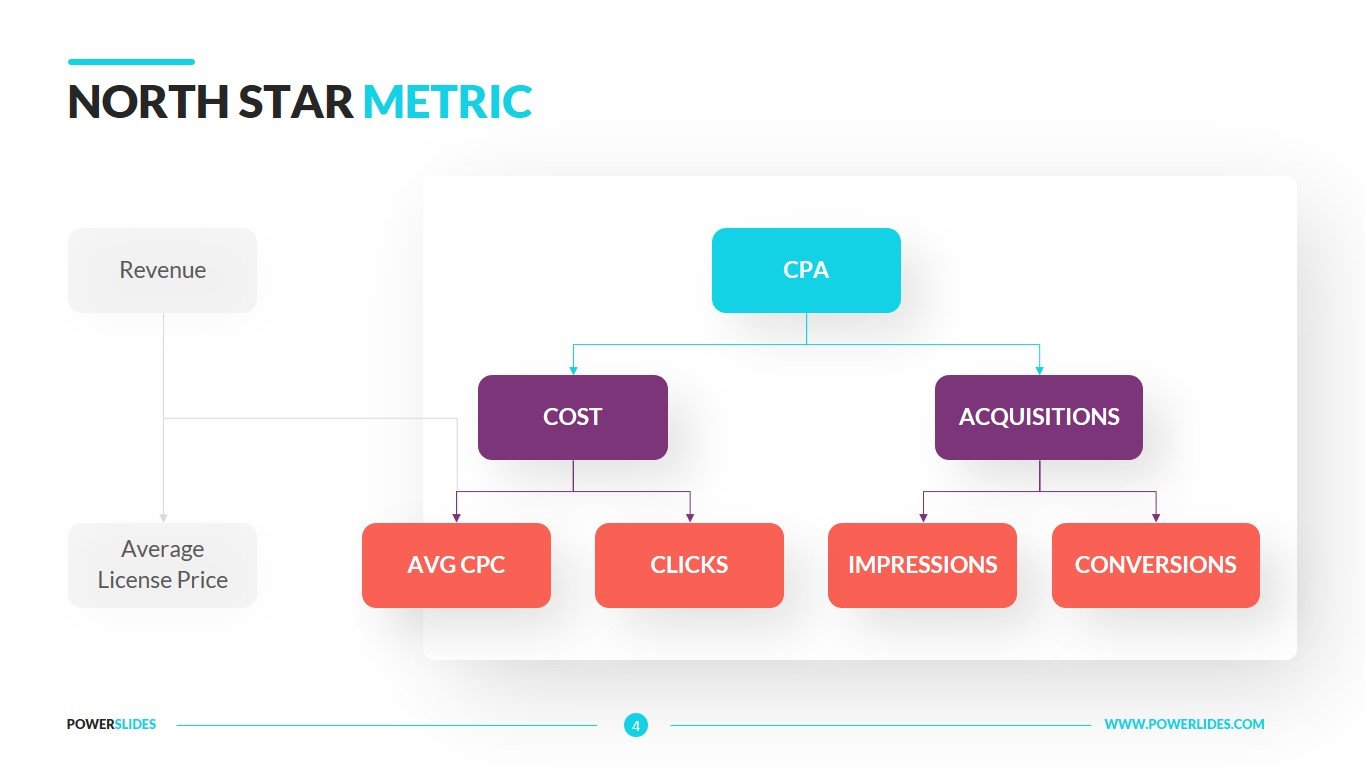
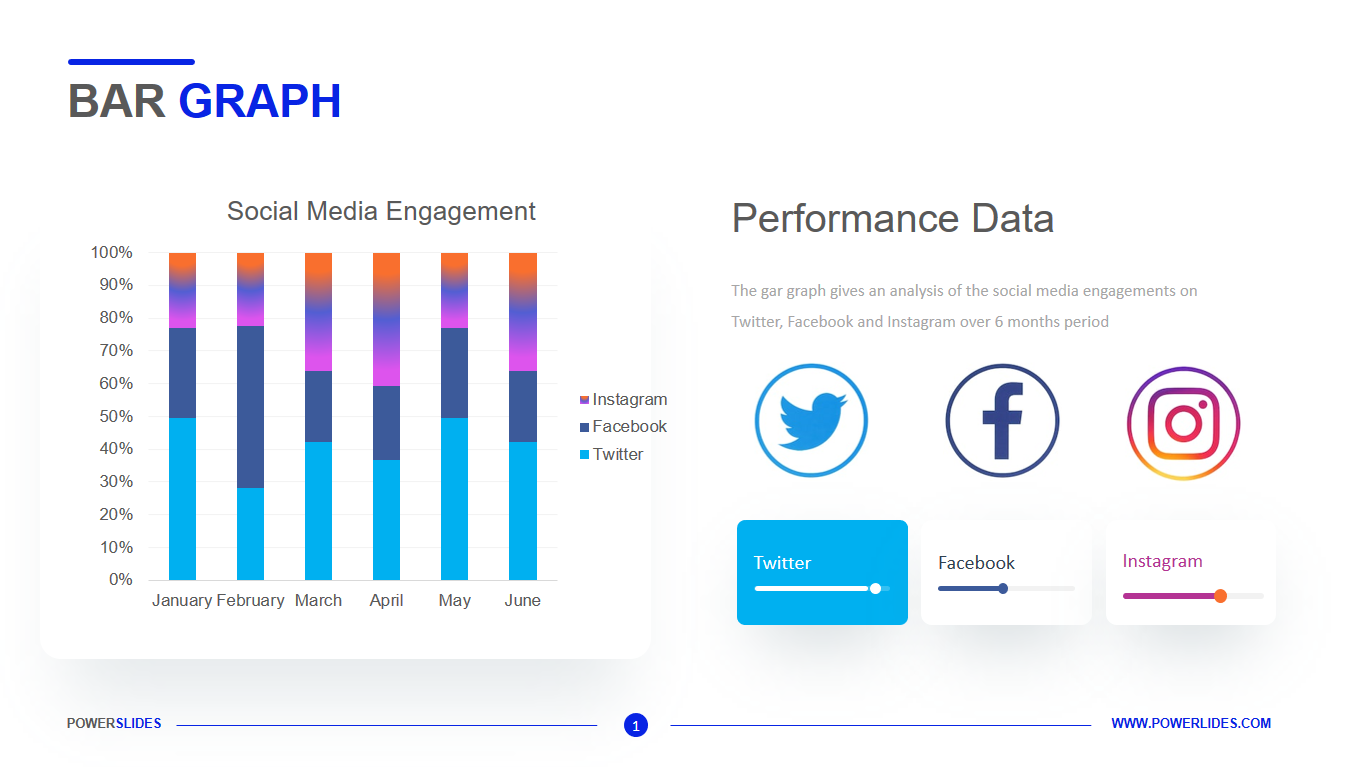
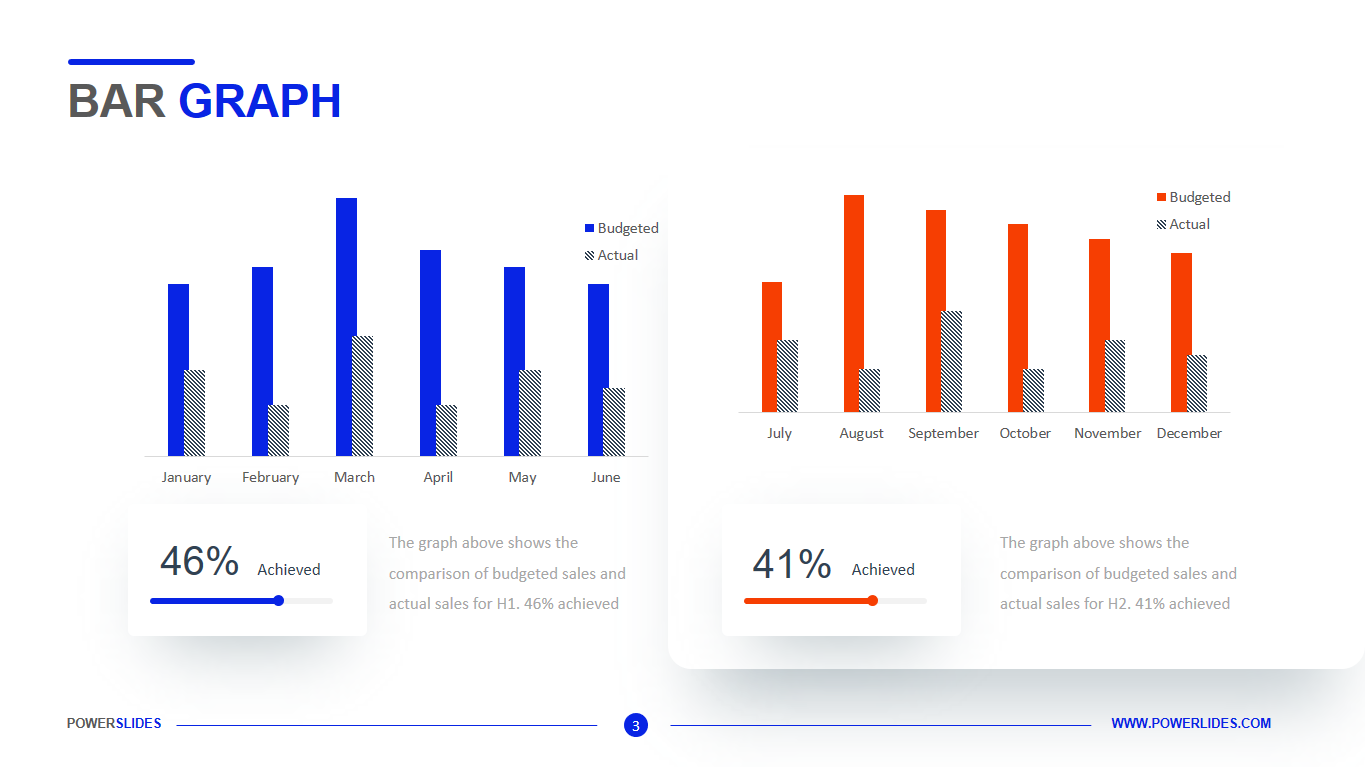
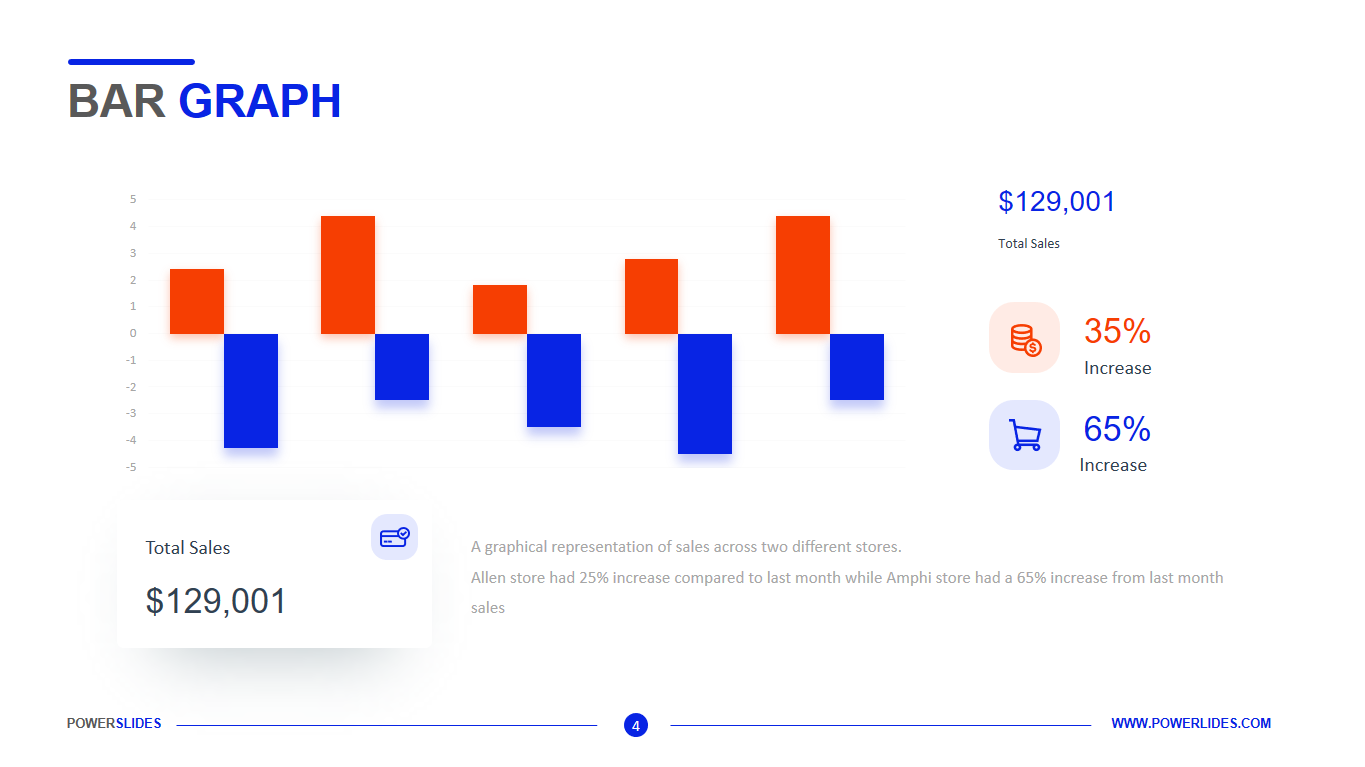
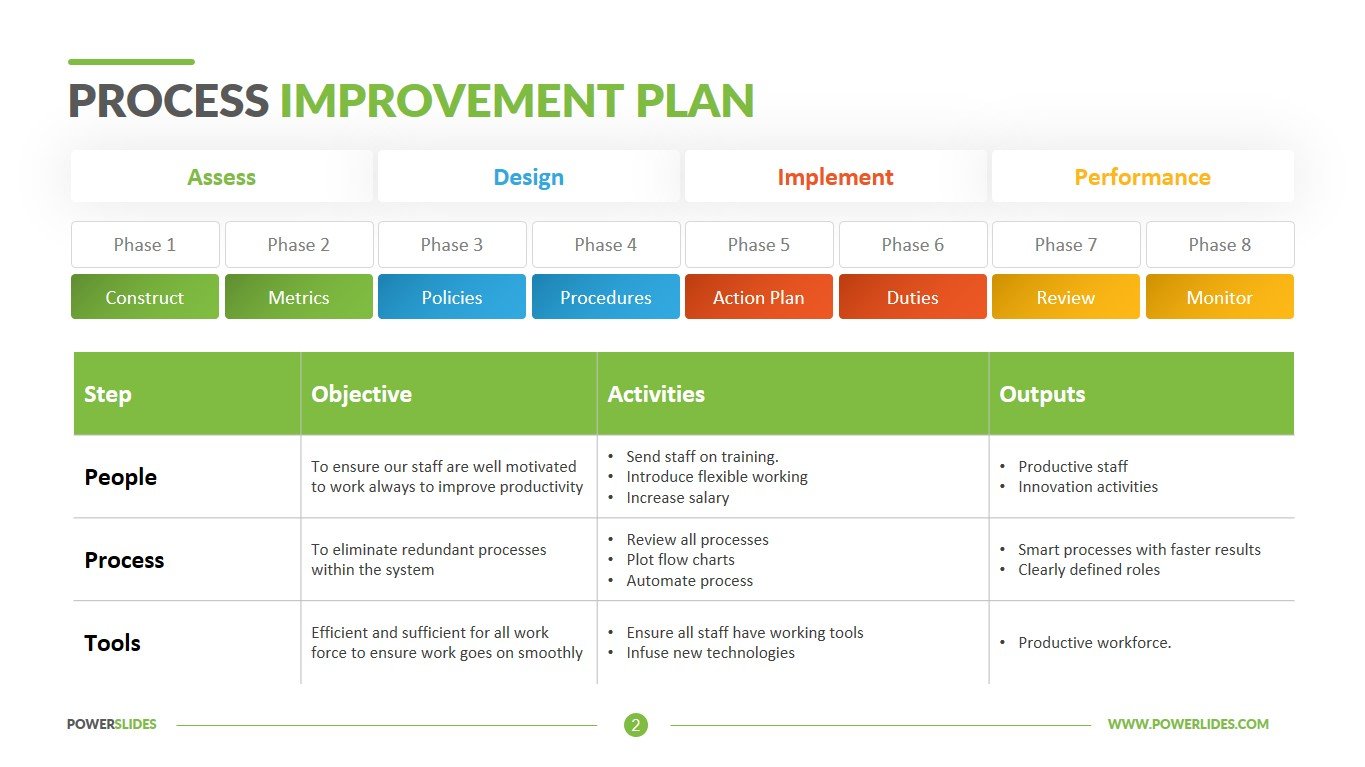
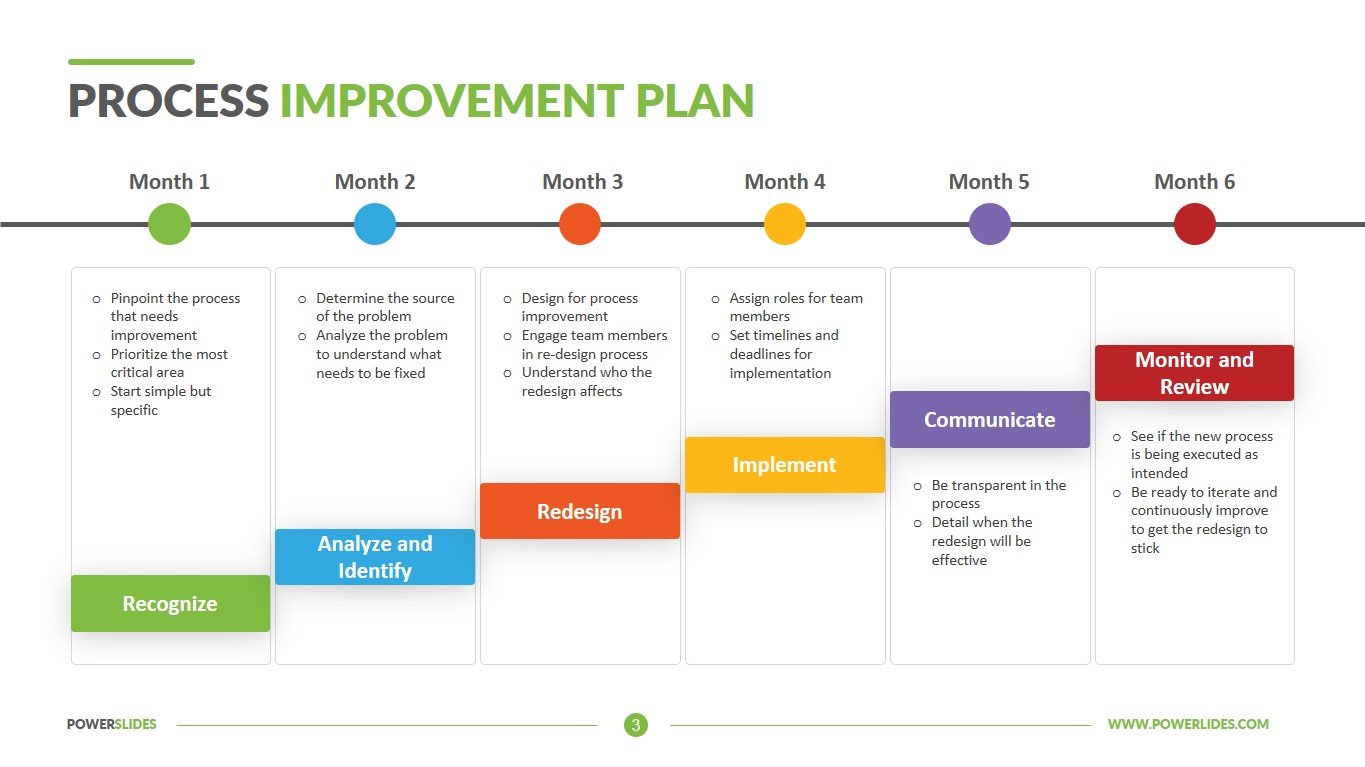
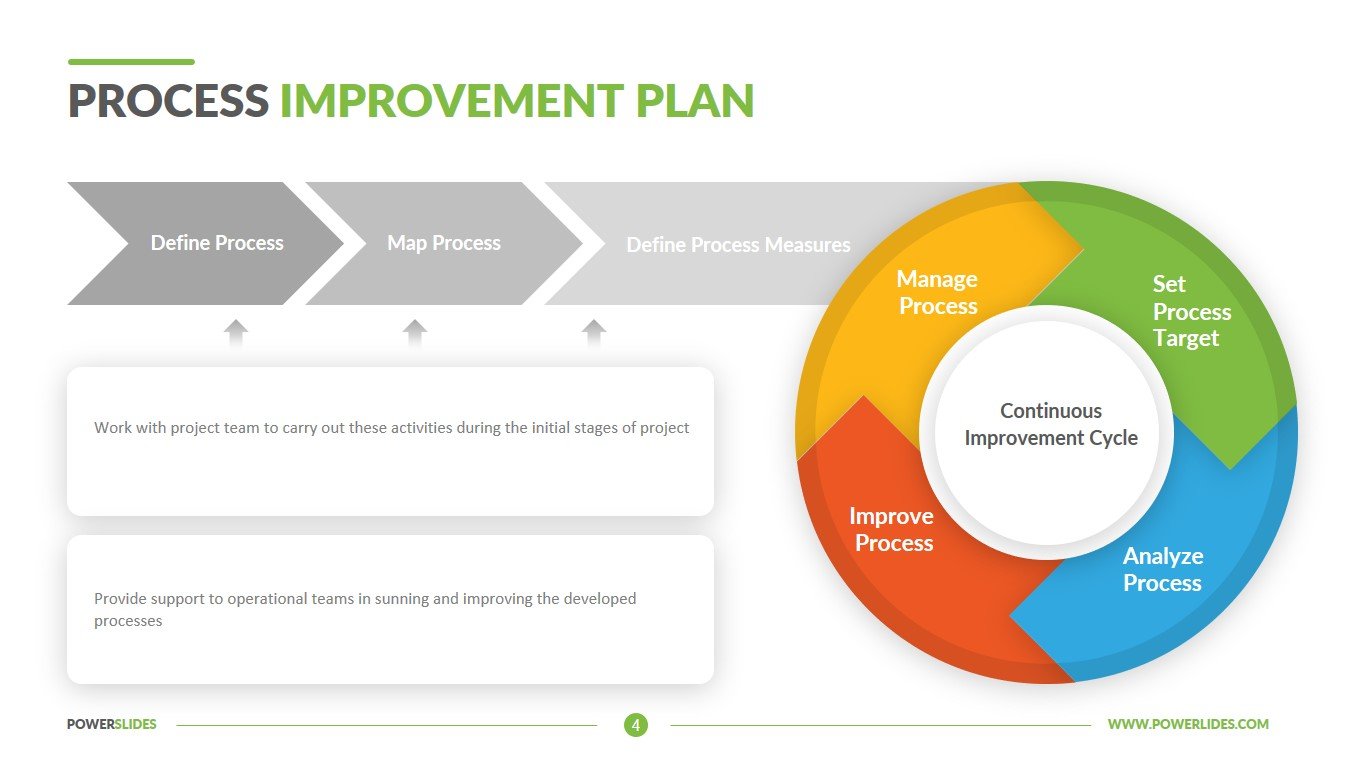
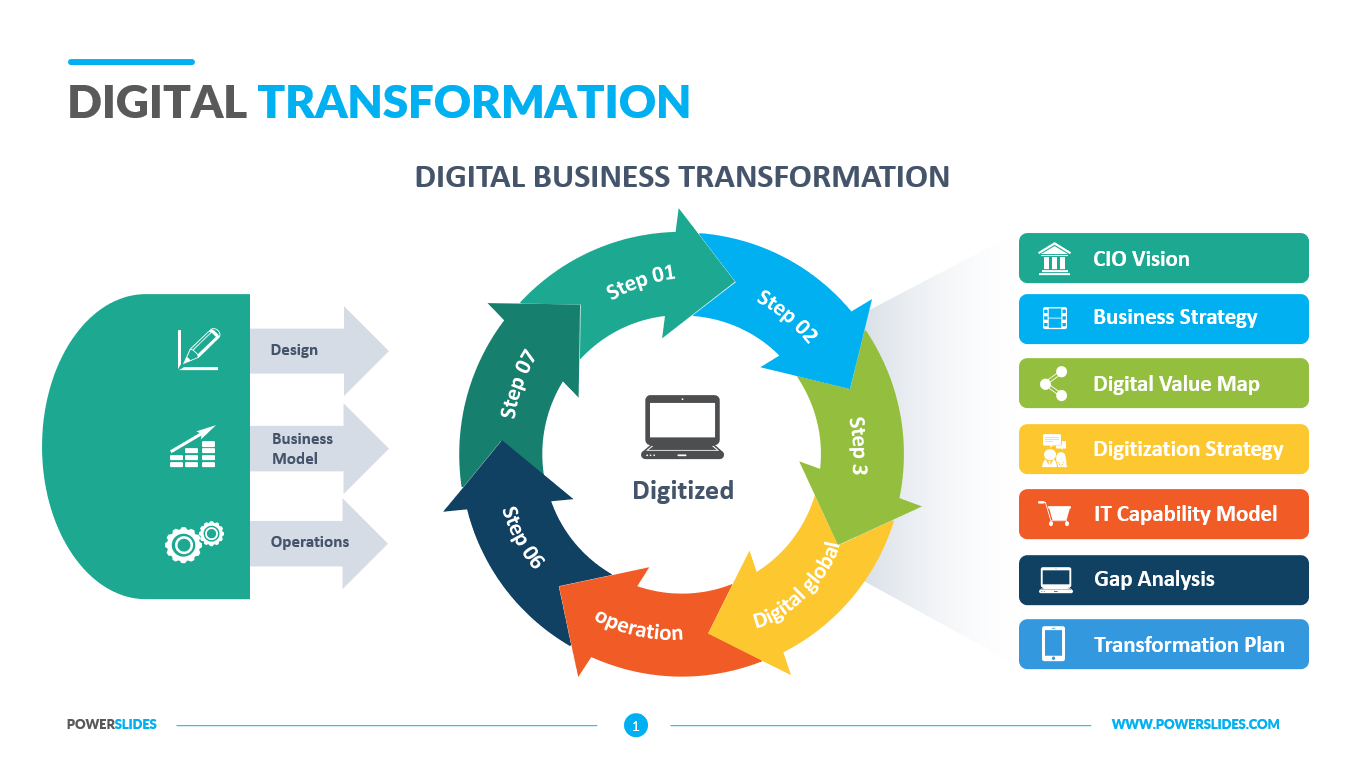
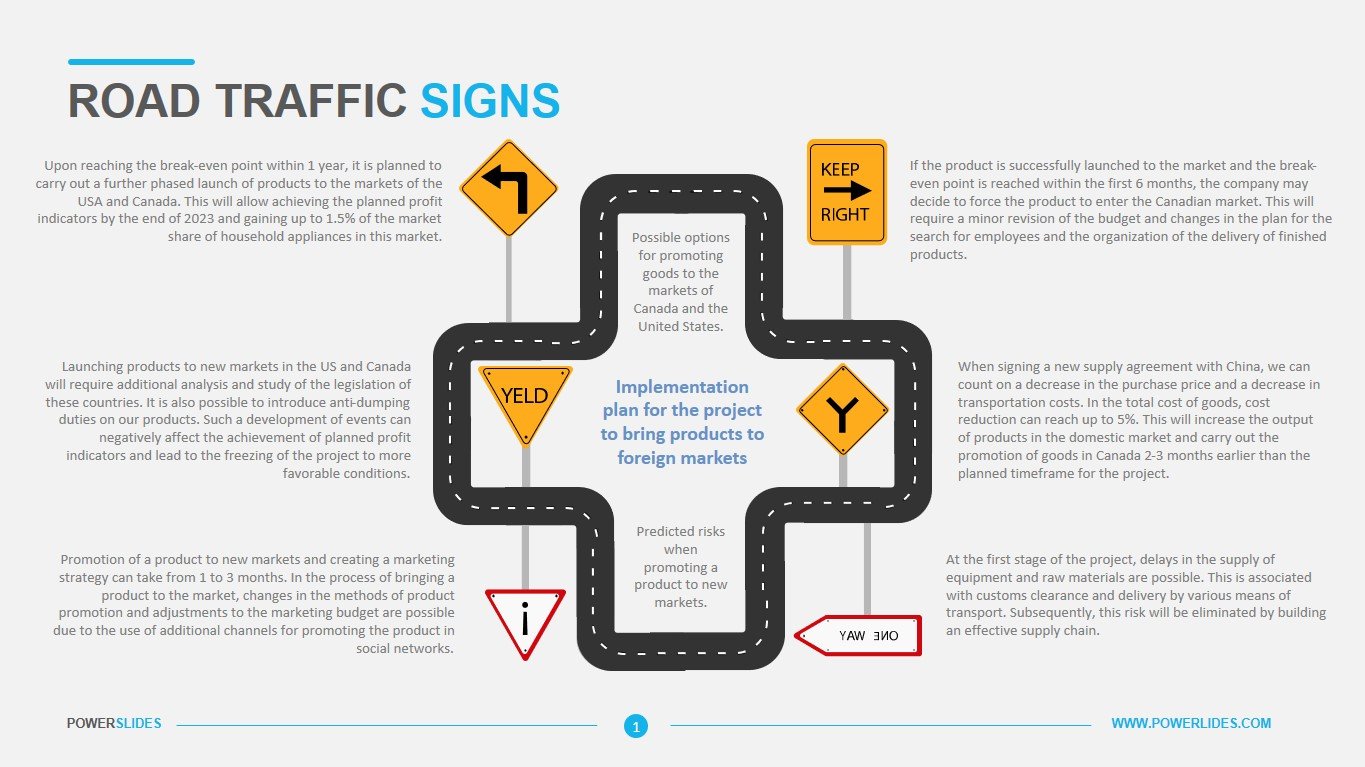
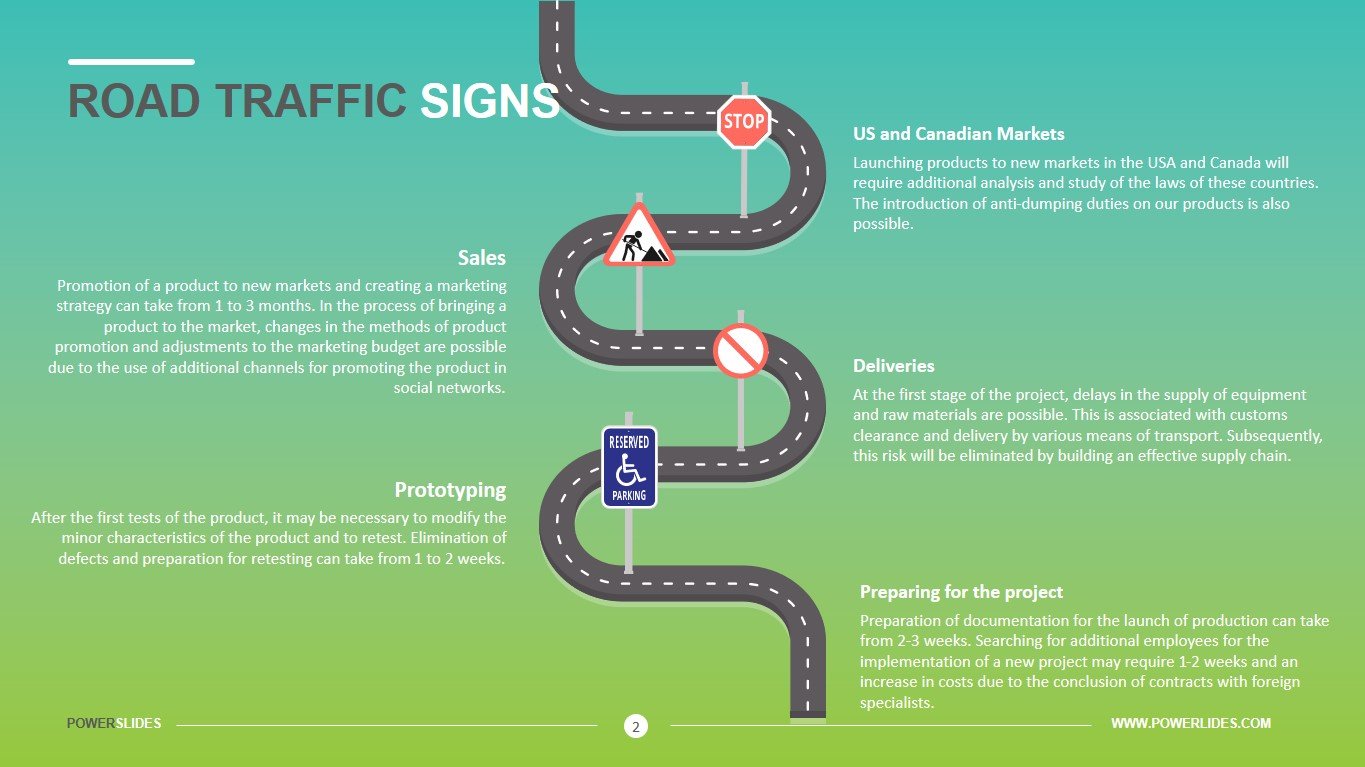
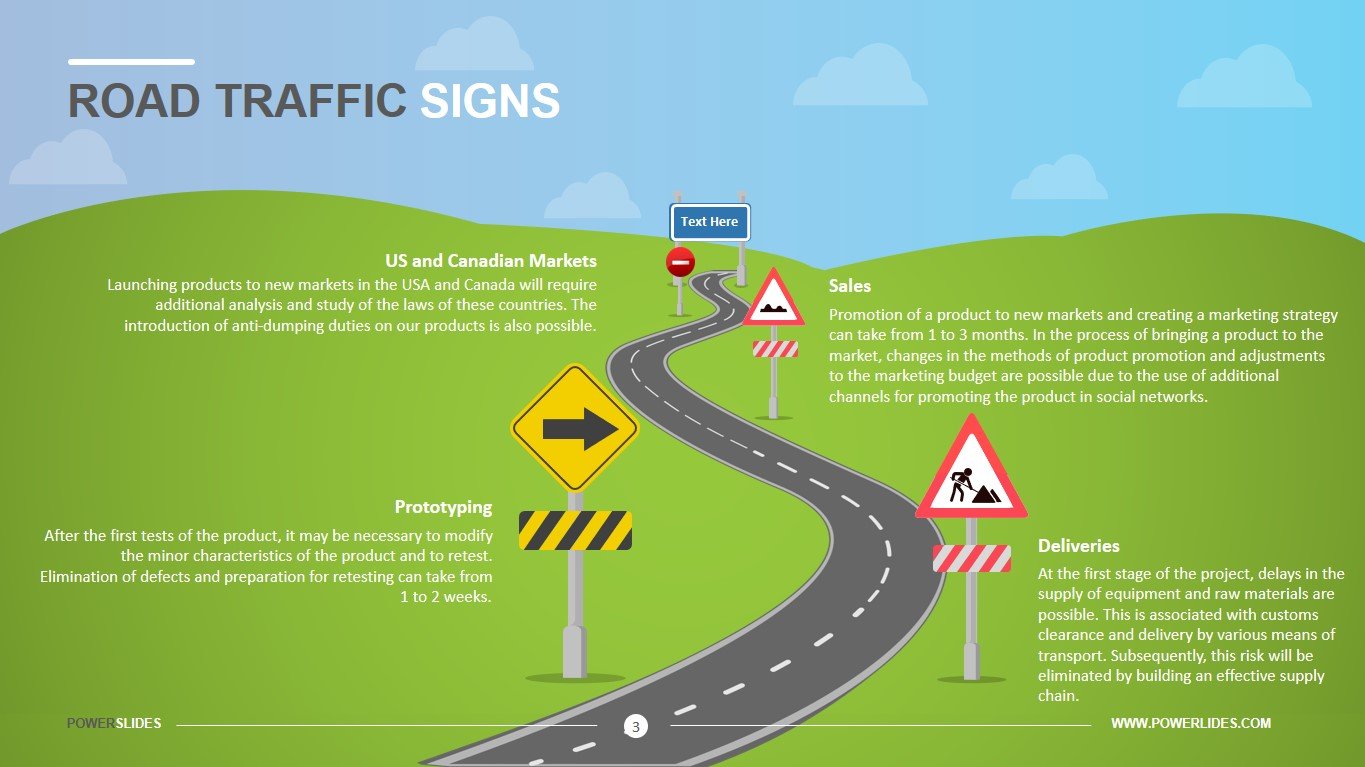
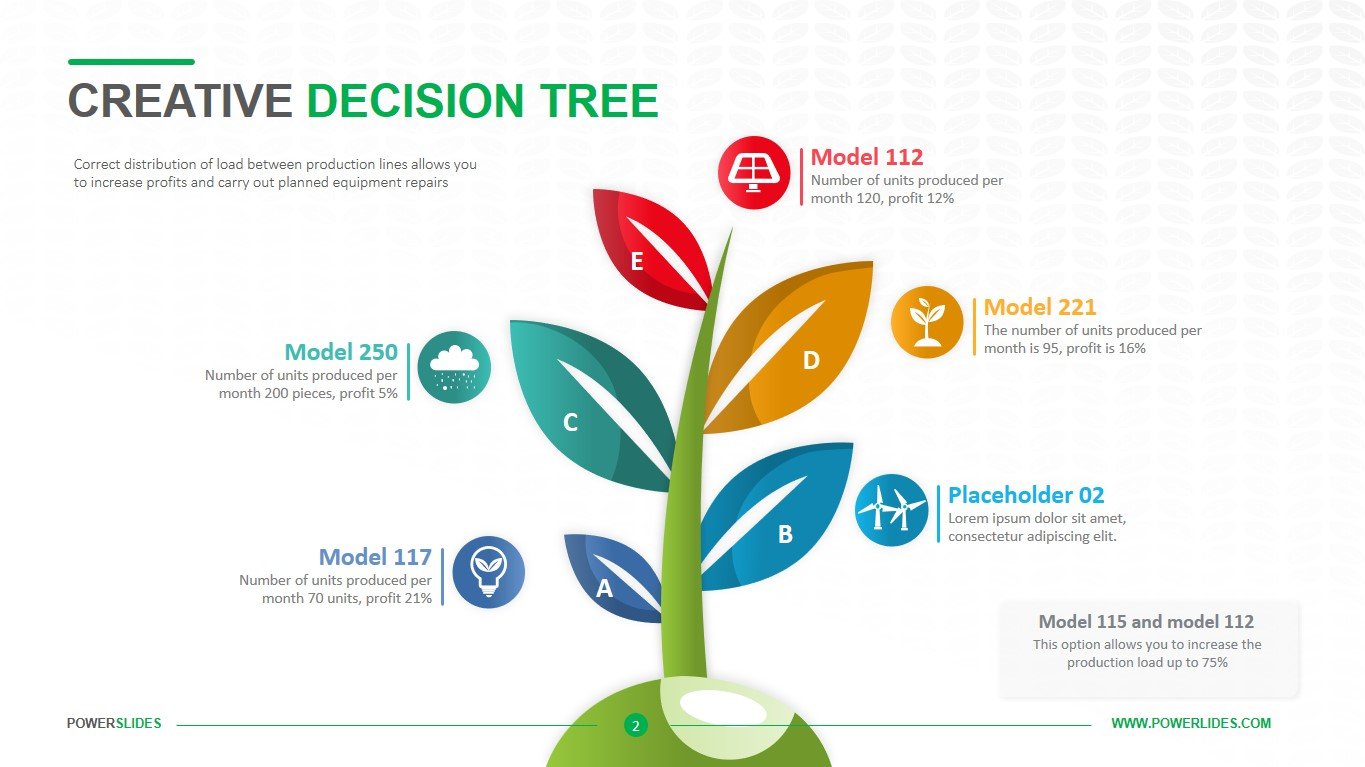
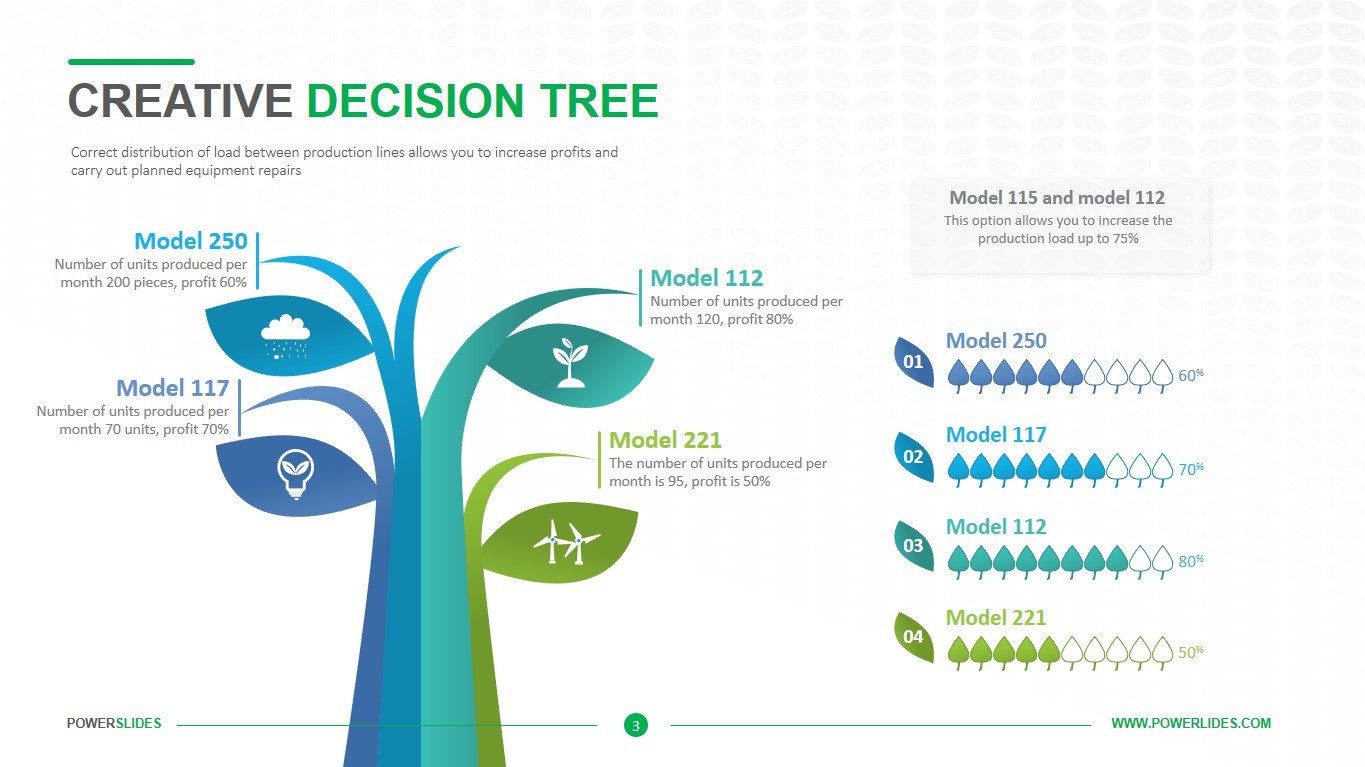
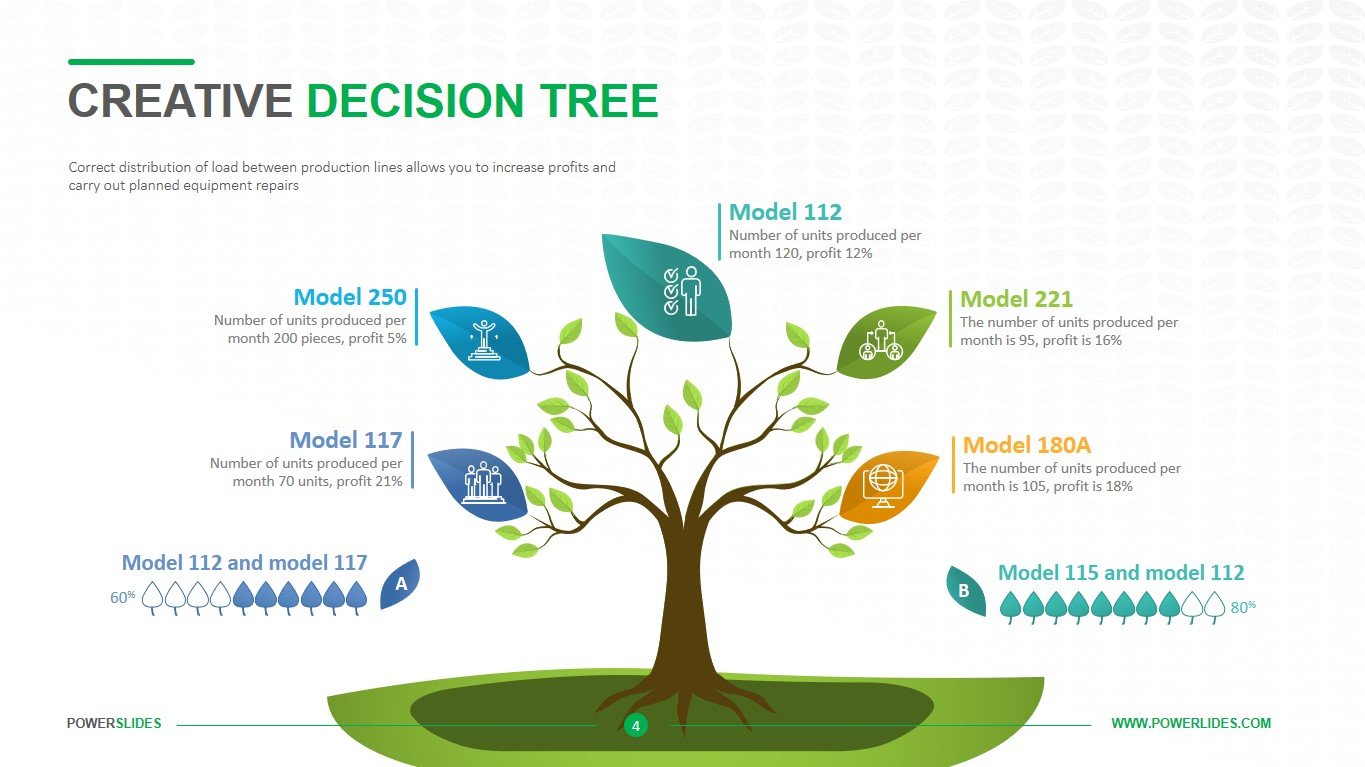
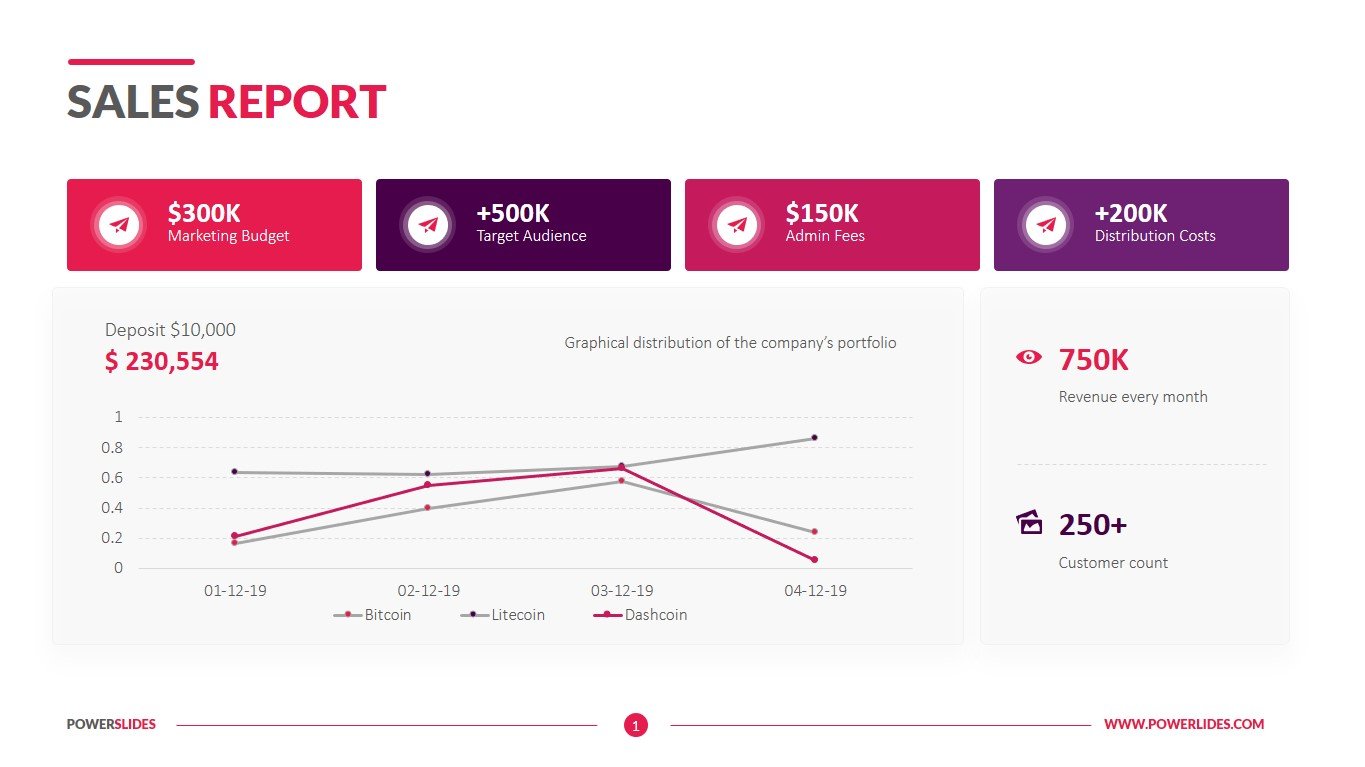
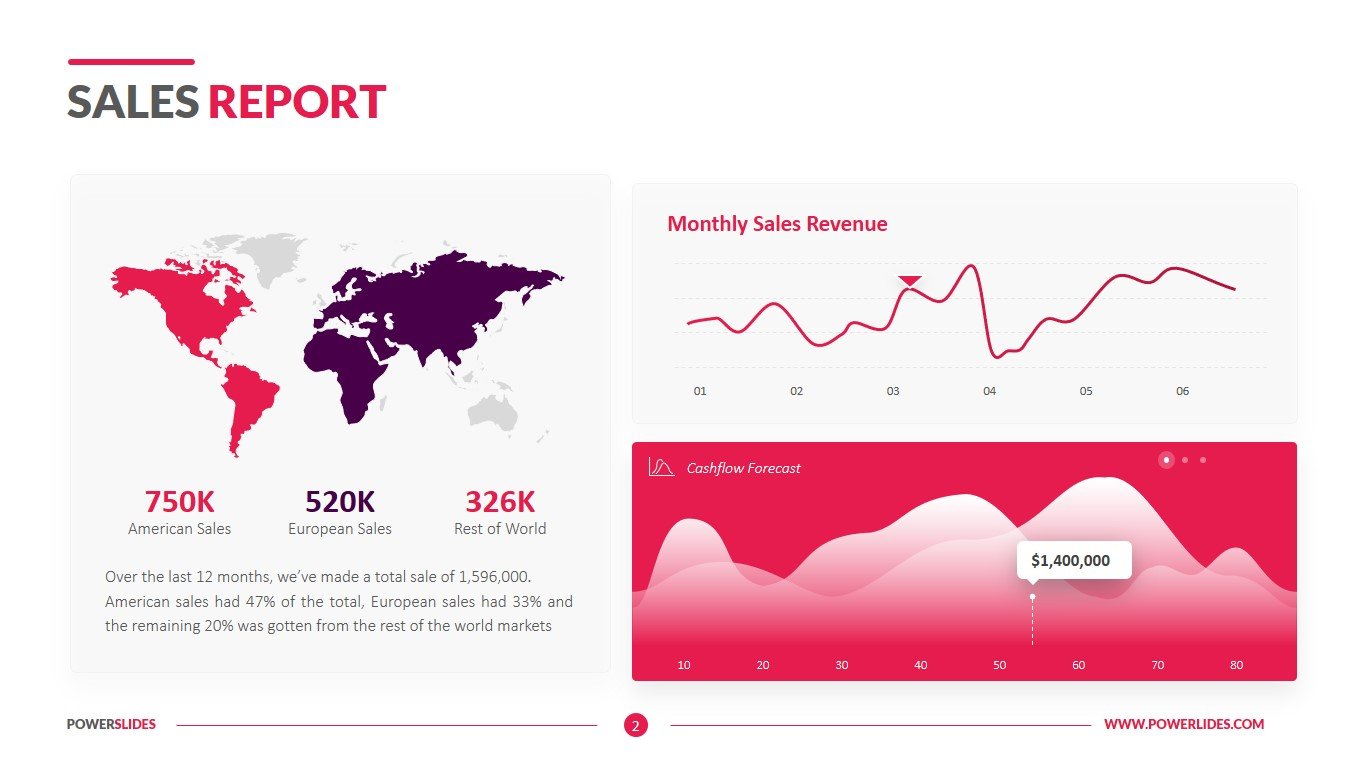
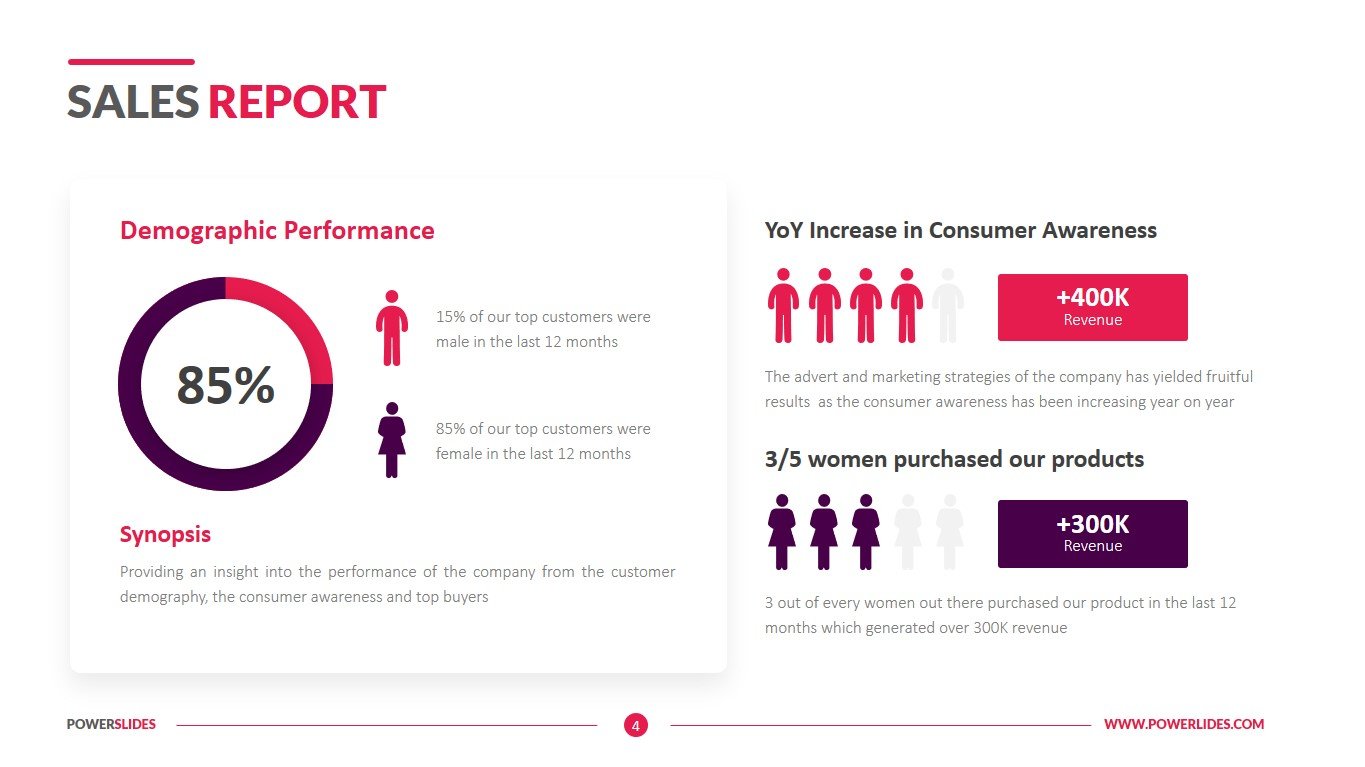
Sales Report Template is a modern tool for preparing your sales report. The first slide contains several graphs where you can indicate the dynamics of changes in sales in monetary terms for various products. At the top, you can indicate the main sources of income and expenses for the reporting period. This slide will be useful for employees of banks and investment companies. You can prepare a statement of actual and planned cash receipts. The second slide contains a map of the world and is designed to prepare a report on sales to various countries of the world. There are also two graphs here that will sufficiently represent your sales record. The slide can be used to forecast a company’s profit or analyze sales in various branches of an international company. The next slide provides an opportunity to compare up to three indicators over a certain period. The slide can be used to analyze sales of seasonal and non-seasonal products. Economists can use this slide to compare different cost items throughout the year. For example, a transport company might compare fuel costs, car repairs, and employee salaries over four quarters. The last slide is for analyzing sales by customer type. For example, you can specify how many men and women bought your product. Marketers can also use this slide when preparing an advertising campaign. They can indicate the potential percentage distribution of sales between men and women. The slide can also be used by HR managers when preparing a company structure report.
The Sales Report Template allows you to customize the color of the graphs, block, and fonts. You can use this template with your other presentations on data analysis or describing business processes, preparing a business plan, and discussing the company’s long-term strategy. You can use this template to prepare a comparative analysis of your competitors before entering a new market. Development Managers and Project Managers will also be interested in this template. You can use the slides when preparing a report on the development of the company for the next month or year. This template is a must for the commercial director and sales managers.


